参考:https://mp.weixin.qq.com/s/gXffcNzixAiTKSBZcf2sBA
最终效果图:
下面全部使用docker部署:
一、部署prometheus
这是一个默认的prometheus配置文件:
[root@localhost prometheus]# cat prometheus.yml
# my global config
global:
  scrape_interval:     15s # Set the scrape interval to every 15 seconds. Default is every 1 minute.
  evaluation_interval: 15s # Evaluate rules every 15 seconds. The default is every 1 minute.
  # scrape_timeout is set to the global default (10s).

# Alertmanager configuration
alerting:
  alertmanagers:
  - static_configs:
    - targets:
      # - alertmanager:9093

# Load rules once and periodically evaluate them according to the global 'evaluation_interval'.
rule_files:
  # - "first_rules.yml"
  # - "second_rules.yml"

# A scrape configuration containing exactly one endpoint to scrape:
# Here it's Prometheus itself.
scrape_configs:
  # The job name is added as a label `job=<job_name>` to any timeseries scraped from this config.
  - job_name: 'prometheus'

    # metrics_path defaults to '/metrics'
    # scheme defaults to 'http'.

    static_configs:
    - targets: ['localhost:9090']
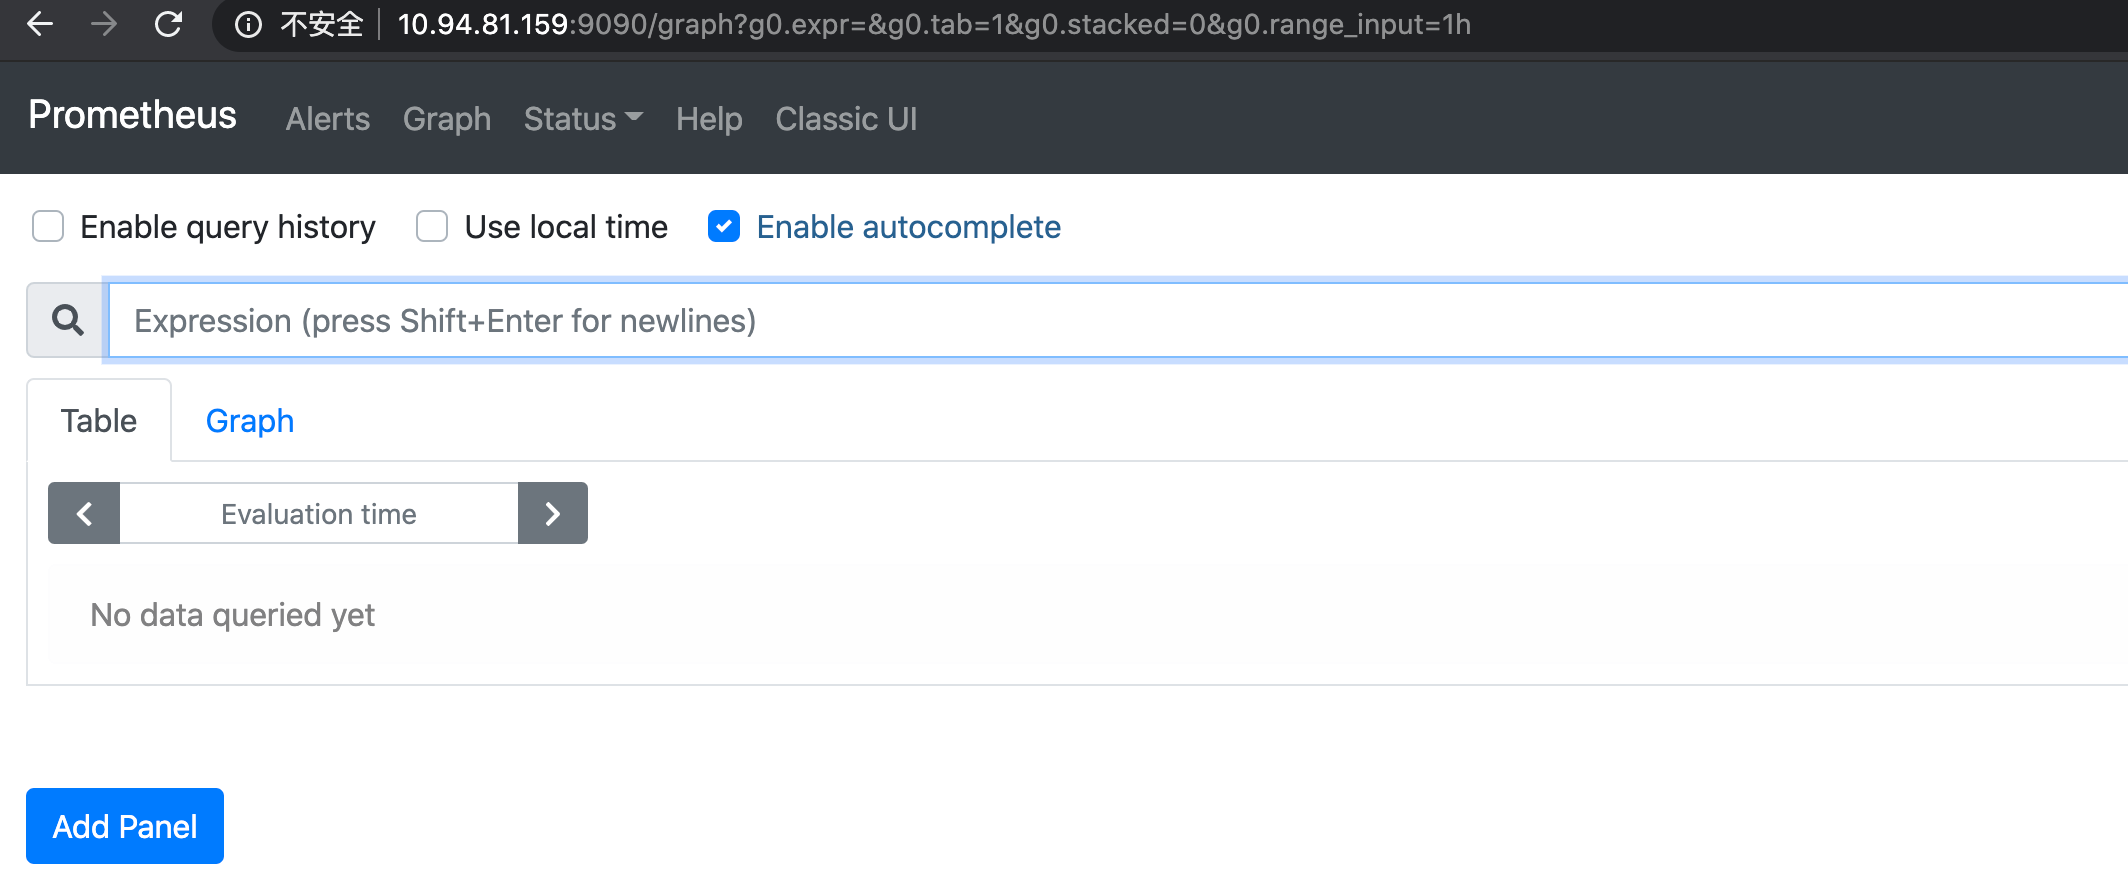
[root@localhost prometheus]# docker run -d --name prometheus -p 9090:9090 -v ${PWD}:/etc/prometheus prom/prometheus:v2.25.0
网页访问9090测试
二、部署grafana
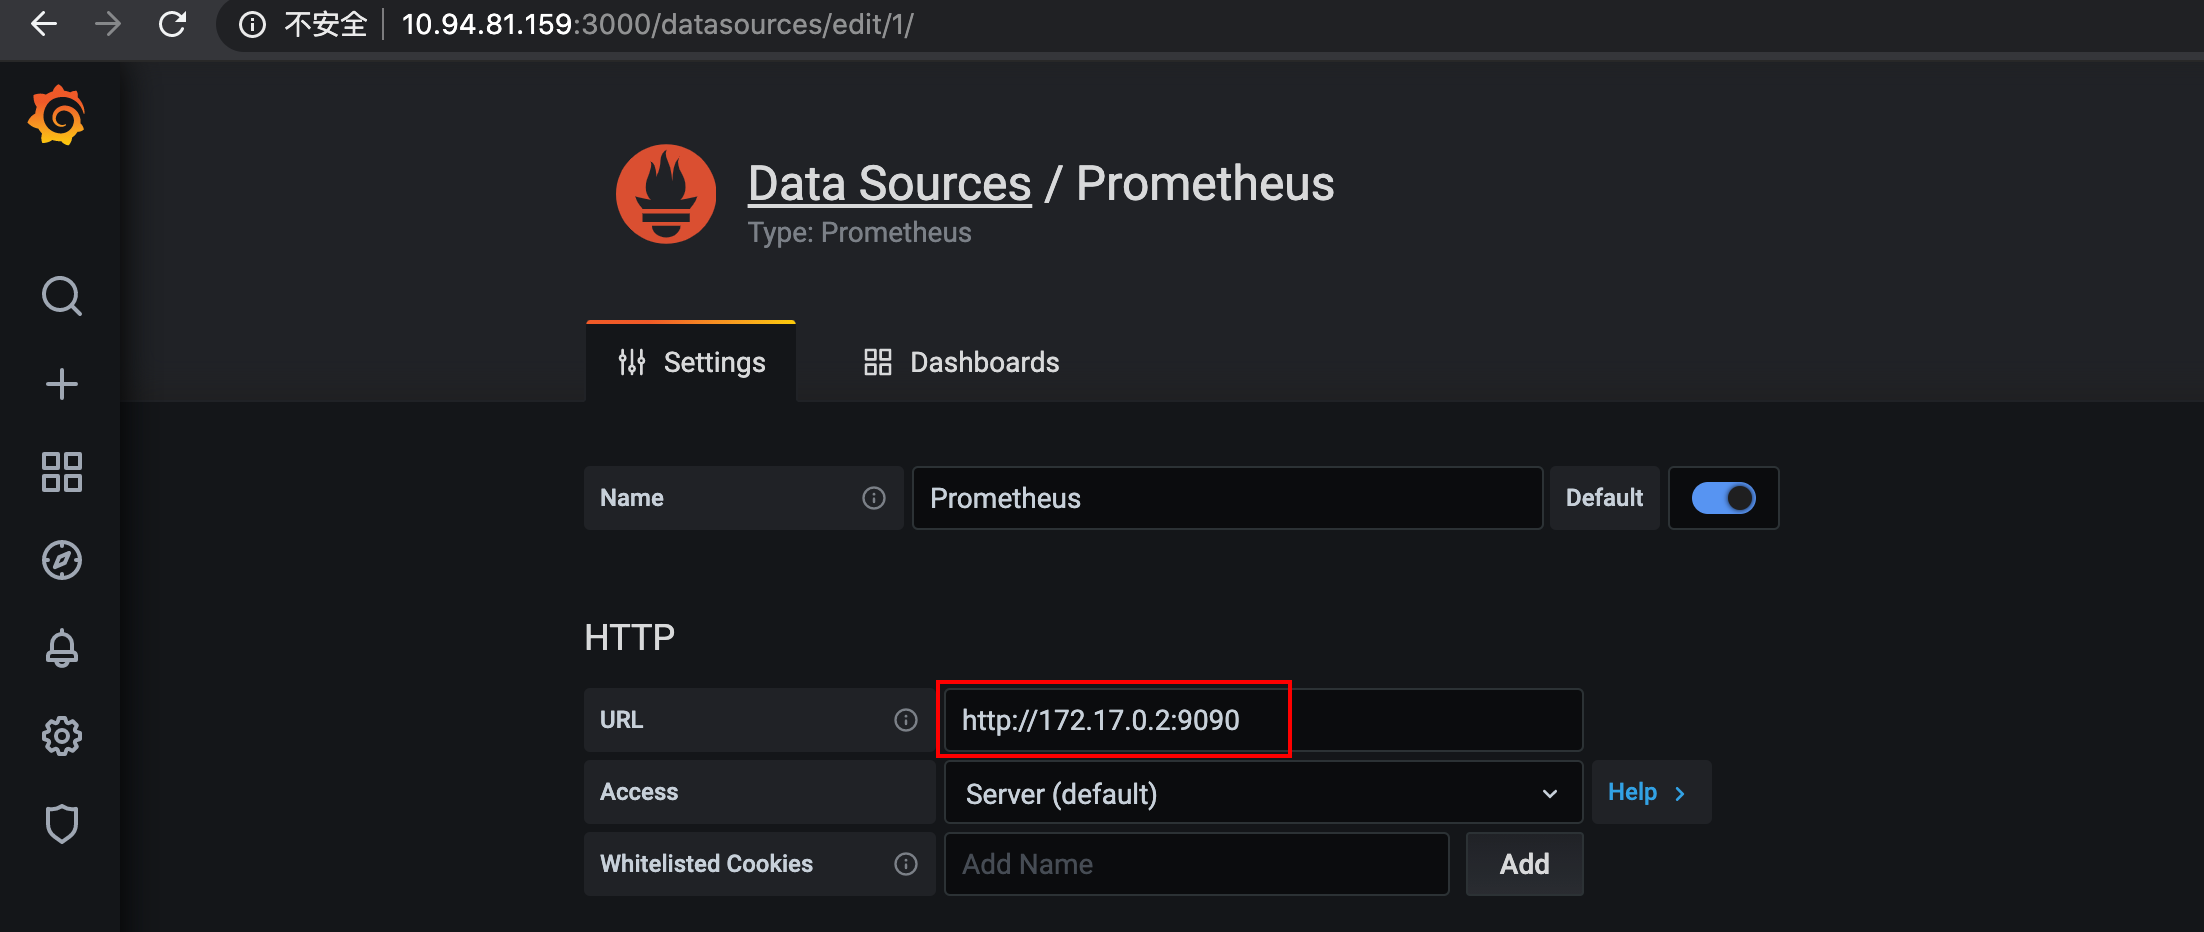
[root@localhost ~]# docker run -d --name=grafana -p 3000:3000 grafana/grafana:7.2.2
访问3000端口,并配置prometheus数据源
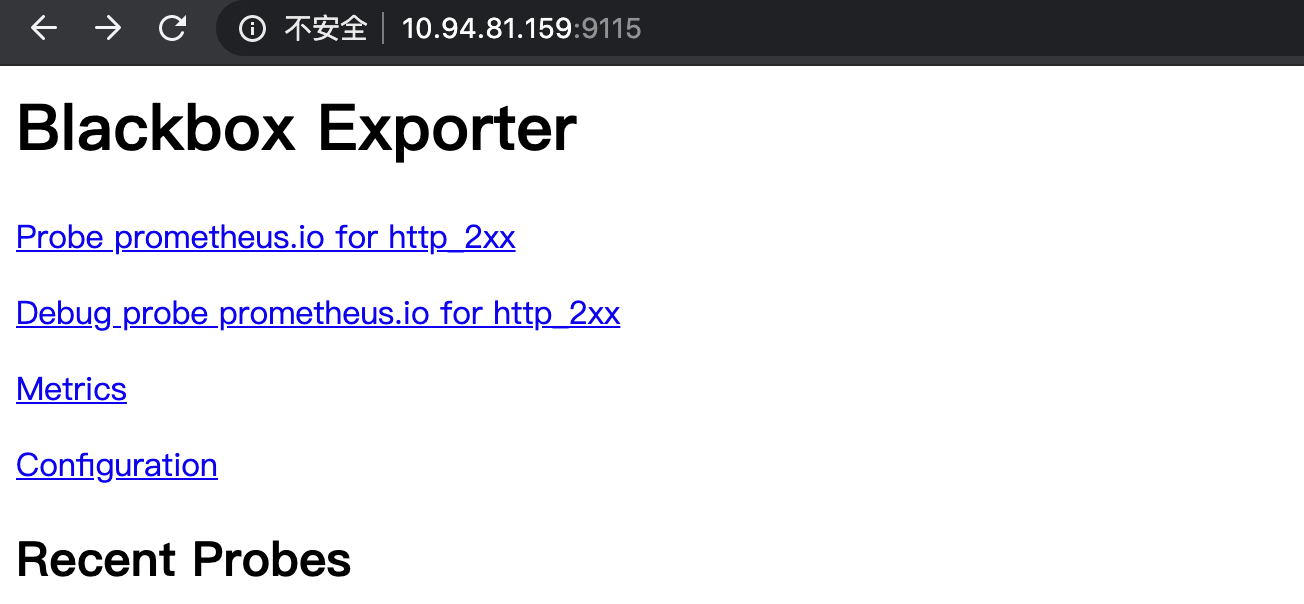
三、部署blackbox-exporter
Blackbox_exporter是prometheus官方的组件,github地址: https://github.com/prometheus/blackbox_exporter
配置文件使用官方默认的,更多配置可以参考官方example.yml:
[root@localhost blackbox-exporter]# cat blackbox.yml
modules:
  http_2xx:  # http 检测模块  Blockbox-Exporter 中所有的探针均是以 Module 的信息进行配置
    prober: http
    timeout: 10s
    http:
      valid_http_versions: ["HTTP/1.1", "HTTP/2"]
      valid_status_codes: [200]  # 这里最好作一个返回状态码,在grafana作图时,有明示---陈刚注释。
      method: GET
      preferred_ip_protocol: "ip4"
  http_post_2xx: # http post 监测模块
    prober: http
    timeout: 10s
    http:
      valid_http_versions: ["HTTP/1.1", "HTTP/2"]
      method: POST
      preferred_ip_protocol: "ip4"
  tcp_connect:  # TCP 检测模块
    prober: tcp
    timeout: 10s
  dns:  # DNS 检测模块
    prober: dns
    dns:
      transport_protocol: "tcp"  # 默认是 udp
      preferred_ip_protocol: "ip4"  # 默认是 ip6
      query_name: "kubernetes.default.svc.cluster.local"
[root@localhost blackbox-exporter]# docker run -d -p 9115:9115 --name blackbox_exporter -v `pwd`:/config prom/blackbox-exporter:master --config.file=/config/blackbox.yml
访问9115端口测试
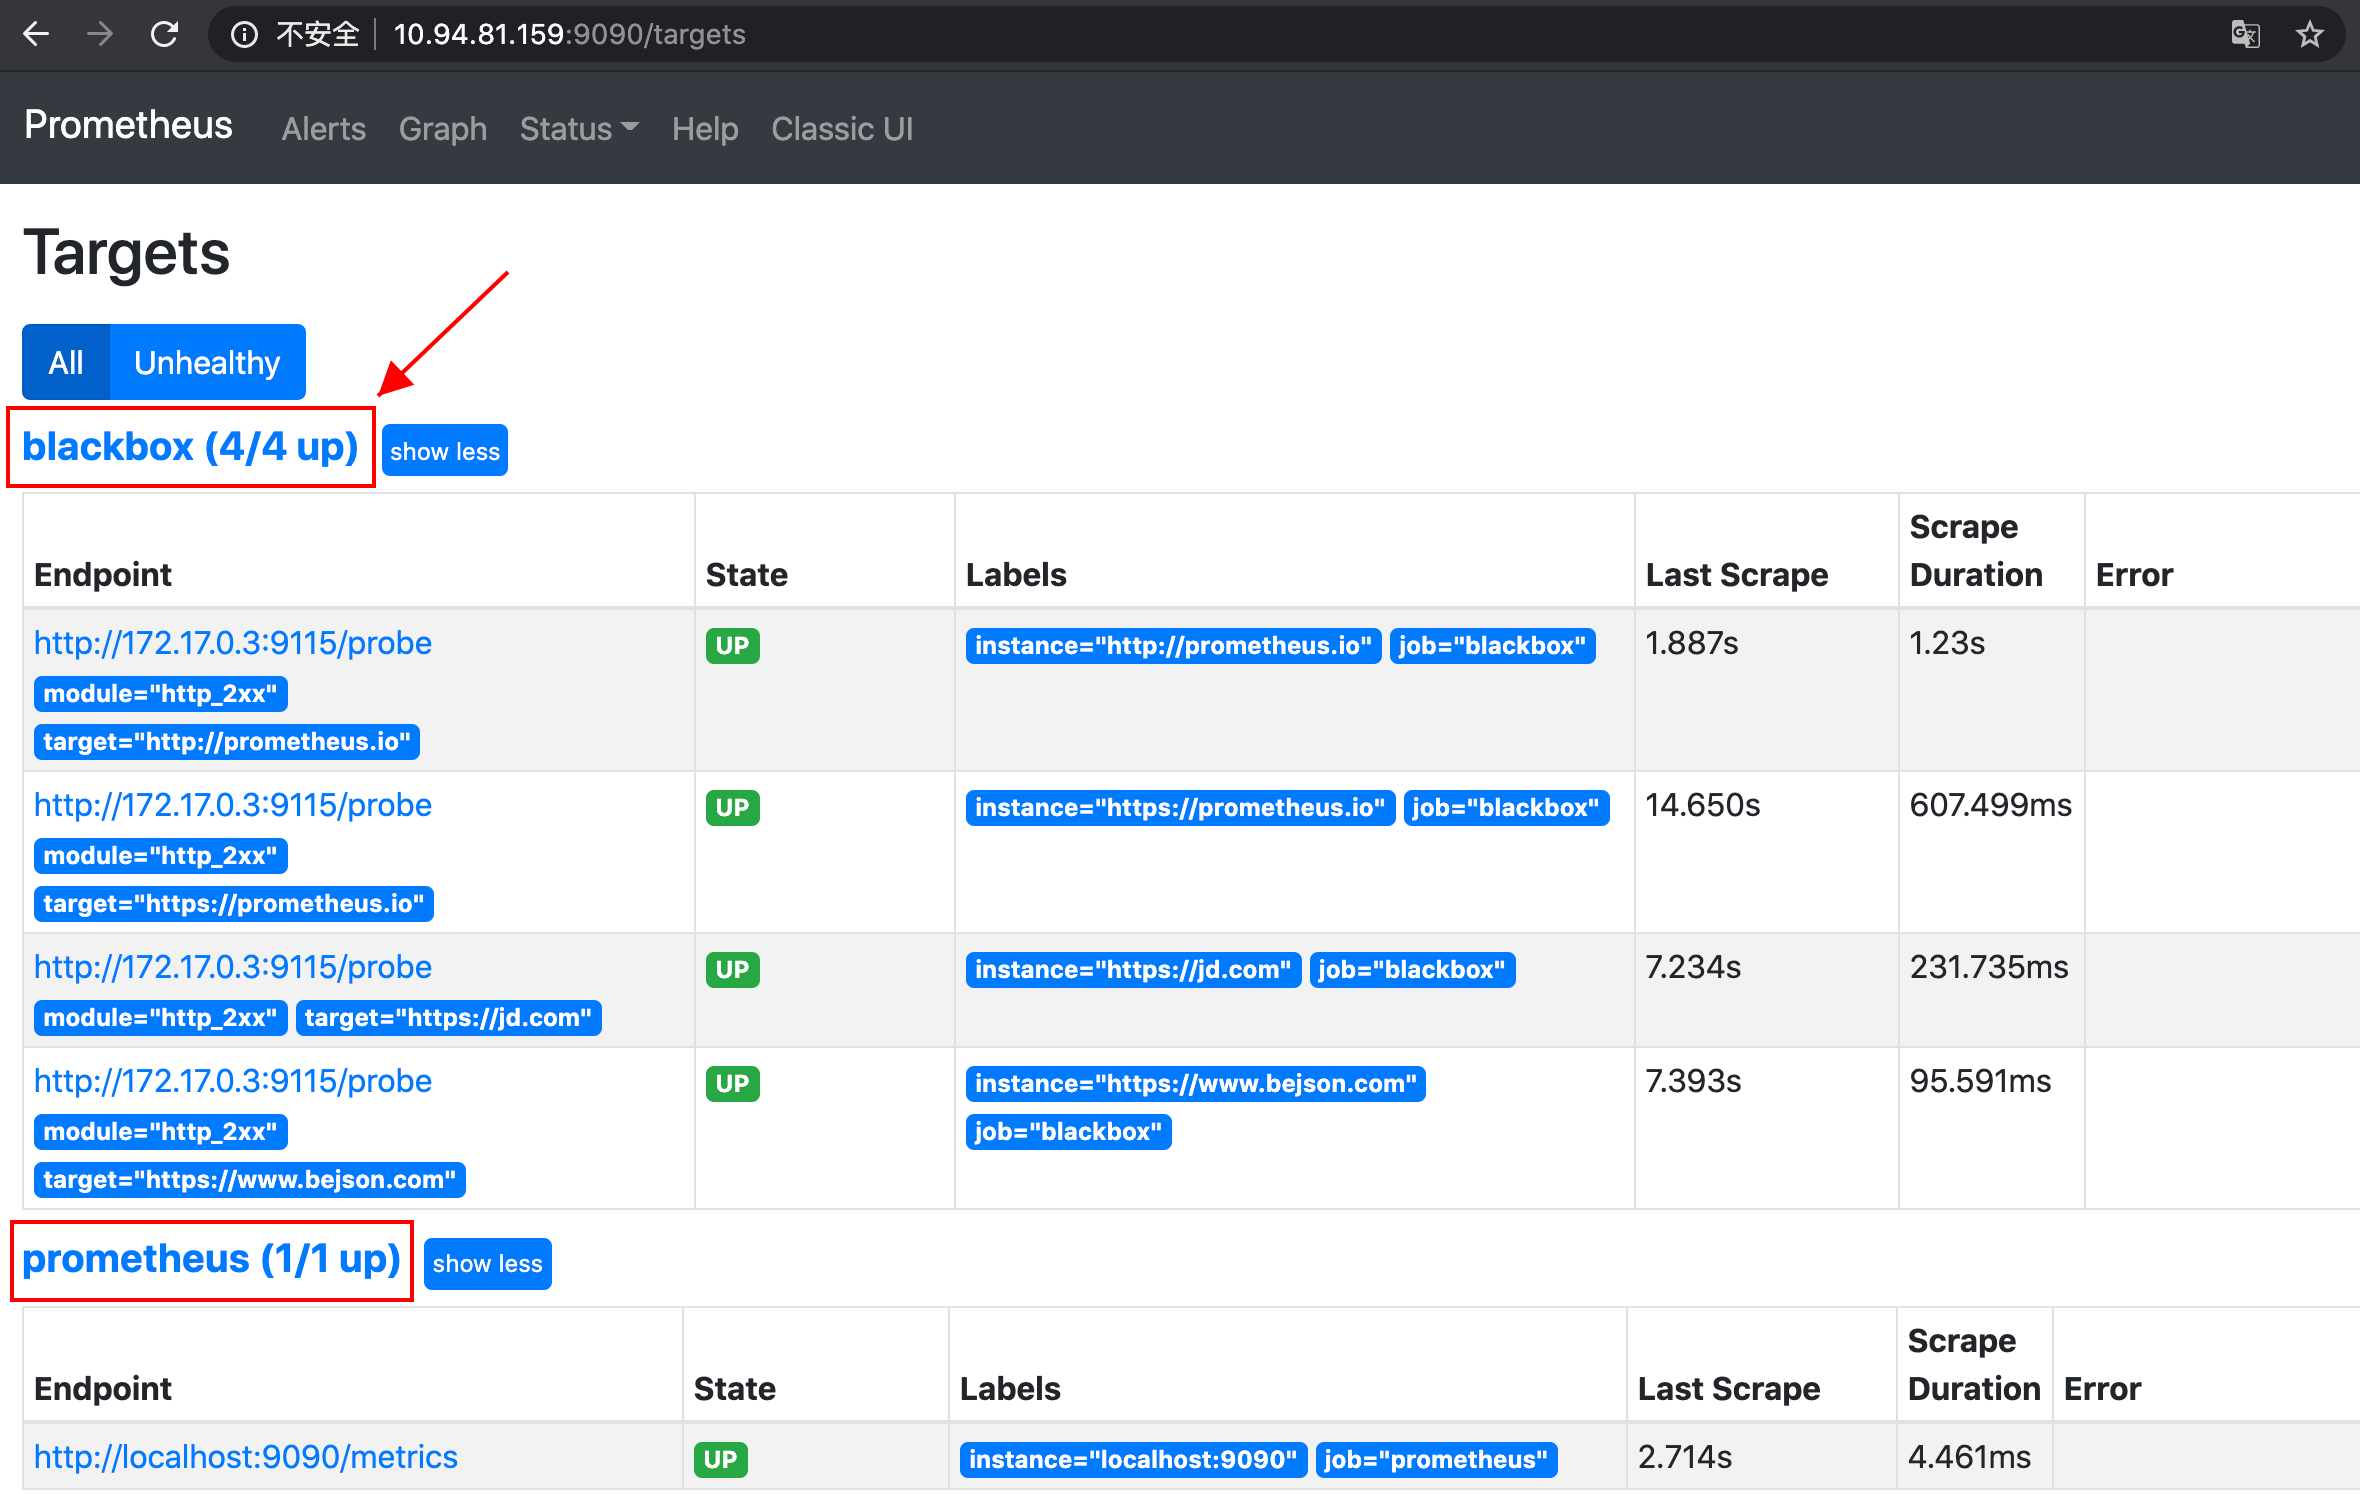
四、prometheus配置文件里添加job,对blackbox数据进行收集
这段内容从官方文档抄过来的:
[root@localhost prometheus]# tail -17 prometheus.yml
  - job_name: 'blackbox'
    metrics_path: /probe
    params:
      module: [http_2xx]  # Look for a HTTP 200 response.
    static_configs:
      - targets:
        - http://prometheus.io    # Target to probe with http.
        - https://prometheus.io   # Target to probe with https.
        - https://jd.com # Target to probe with http on port 8080.
        - https://www.bejson.com # Target to probe with http on port 8080.
    relabel_configs:
      - source_labels: [__address__]
        target_label: __param_target
      - source_labels: [__param_target]
        target_label: instance
      - target_label: __address__
        replacement: 172.17.0.3:9115  # The blackbox exporter's real hostname:port.
Lifecycle api没有开启(curl -X POST http://127.0.0.1:9090/-/reload),只能手动重载配置:
[root@localhost prometheus]# docker exec -it prometheus kill -1 1
prometheus页面查看target
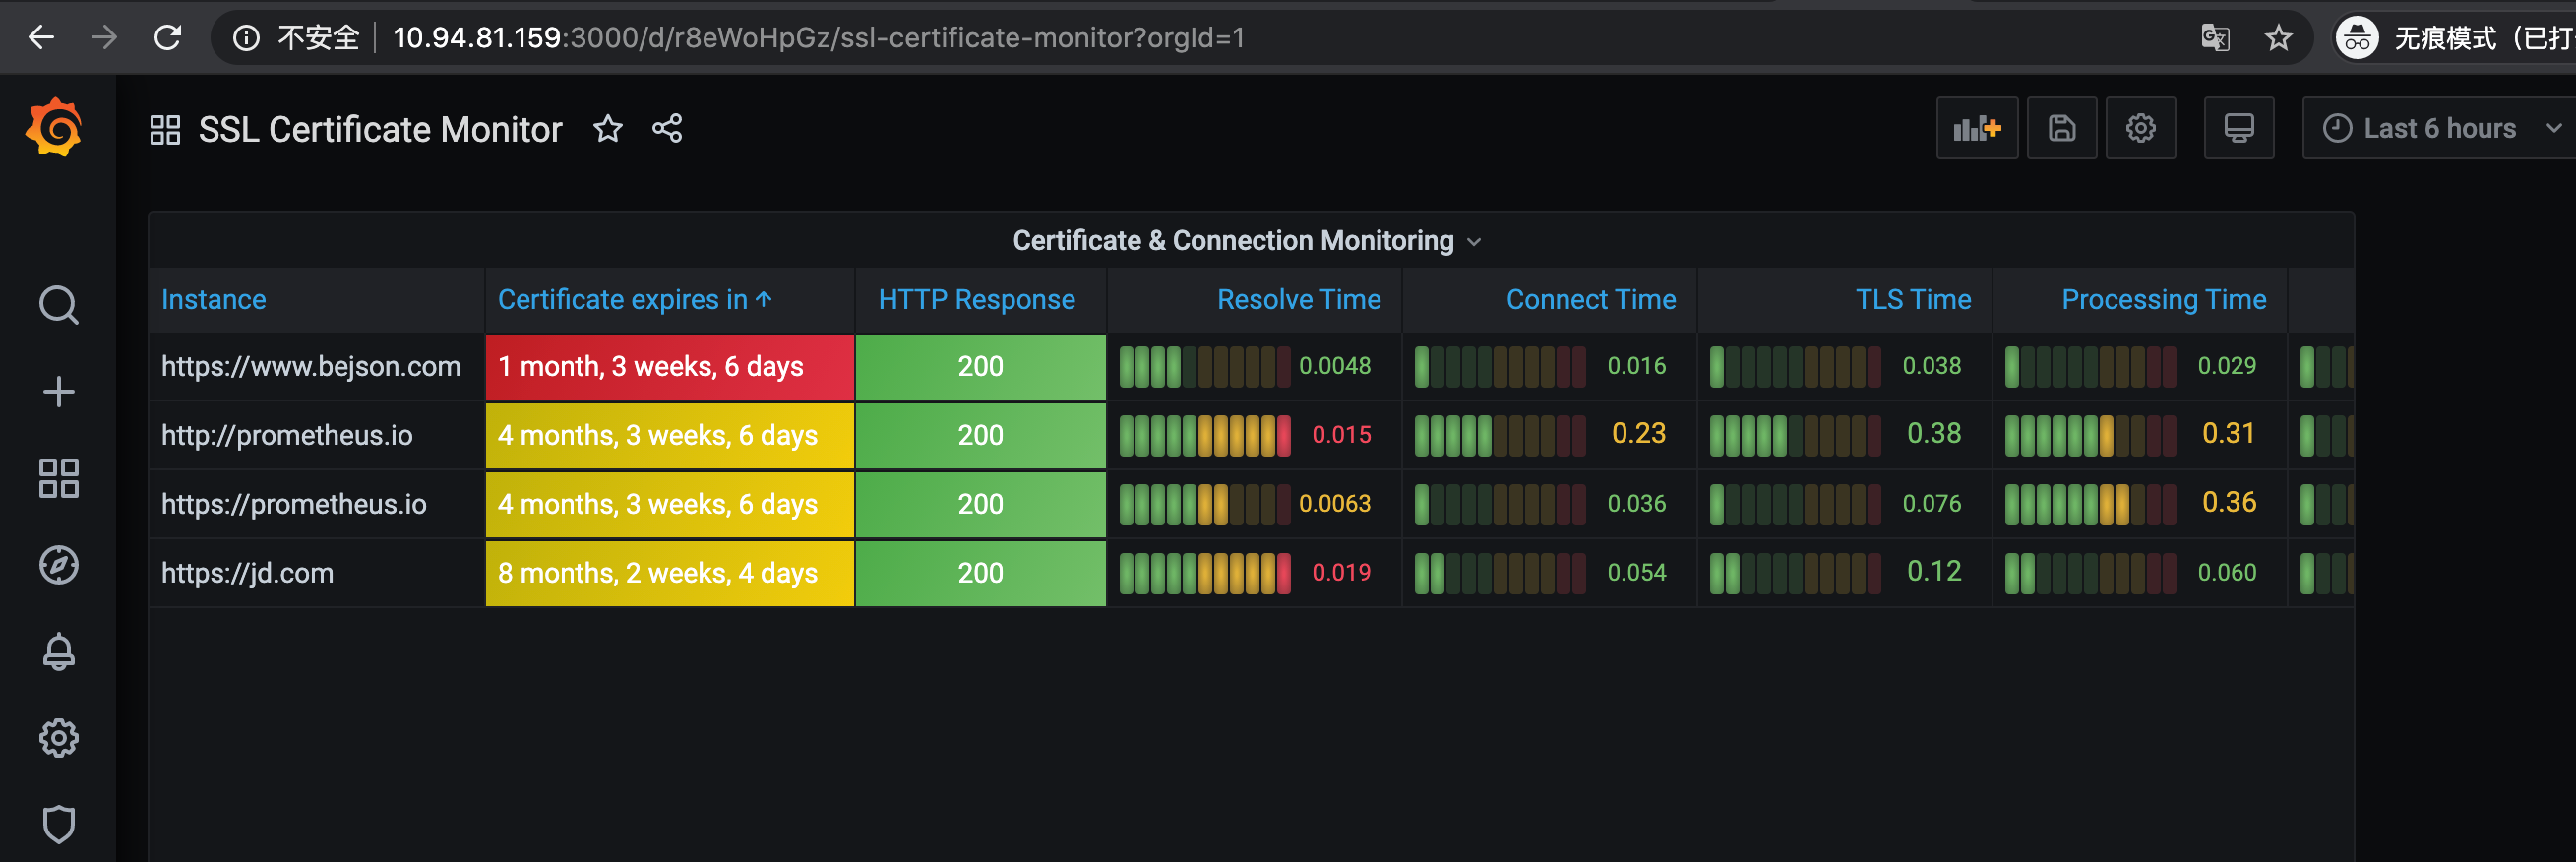
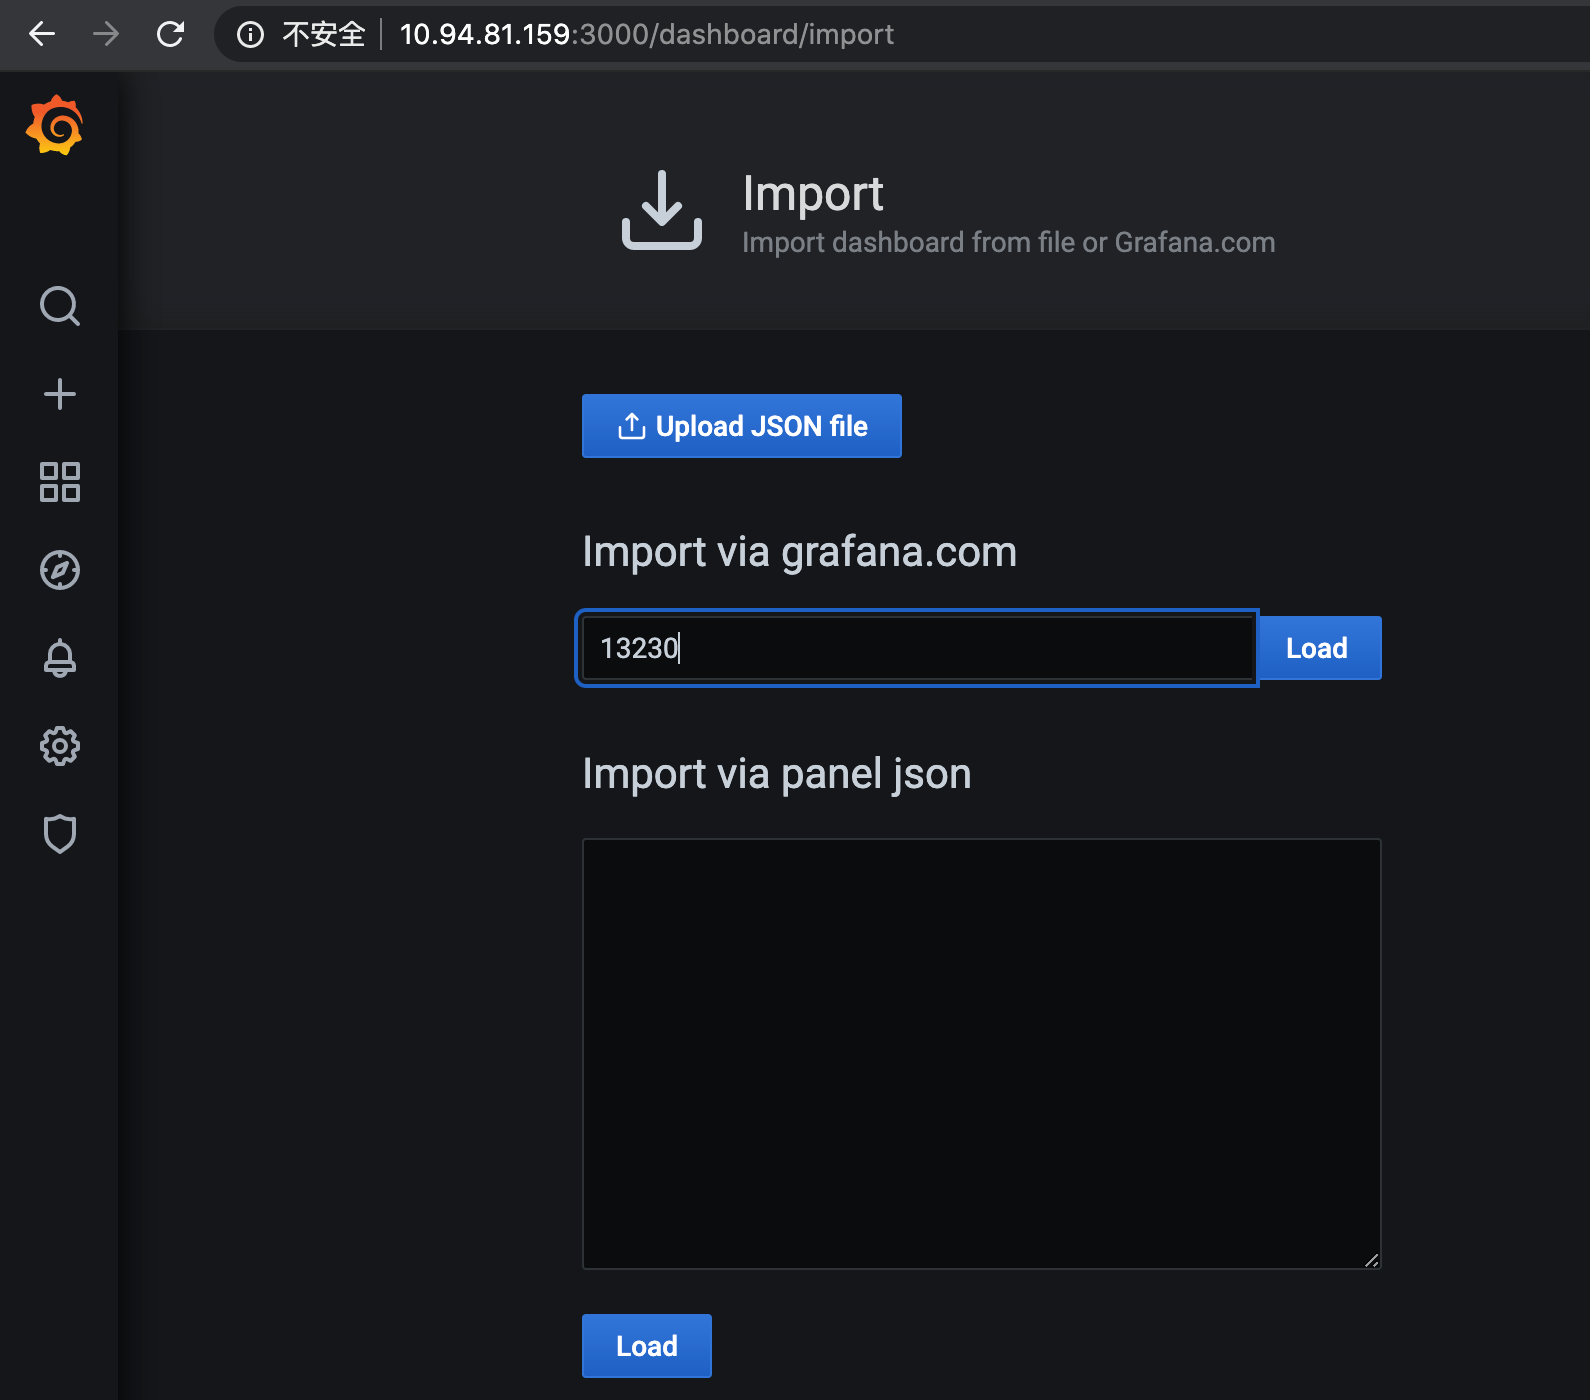
五、prometheus导入dashborad
使用的dashboard是这个: https://grafana.com/grafana/dashboards/13230
六、看效果
七、设置prometheus告警
首先在prometheus.yml文件里面通过rule_files指定告警规则文件的访问路径
/etc/prometheus/rules $ cat /etc/prometheus/prometheus.yml
rule_files:
  - "/etc/prometheus/rules/*.rules"
然后编辑ssl告警规则文件
/etc/prometheus $ mkdir /etc/prometheus/rules
/etc/prometheus/rules $ cat /etc/prometheus/rules/ssl-expire-alert.rules
groups:
- name: ssl_expiry
rules:
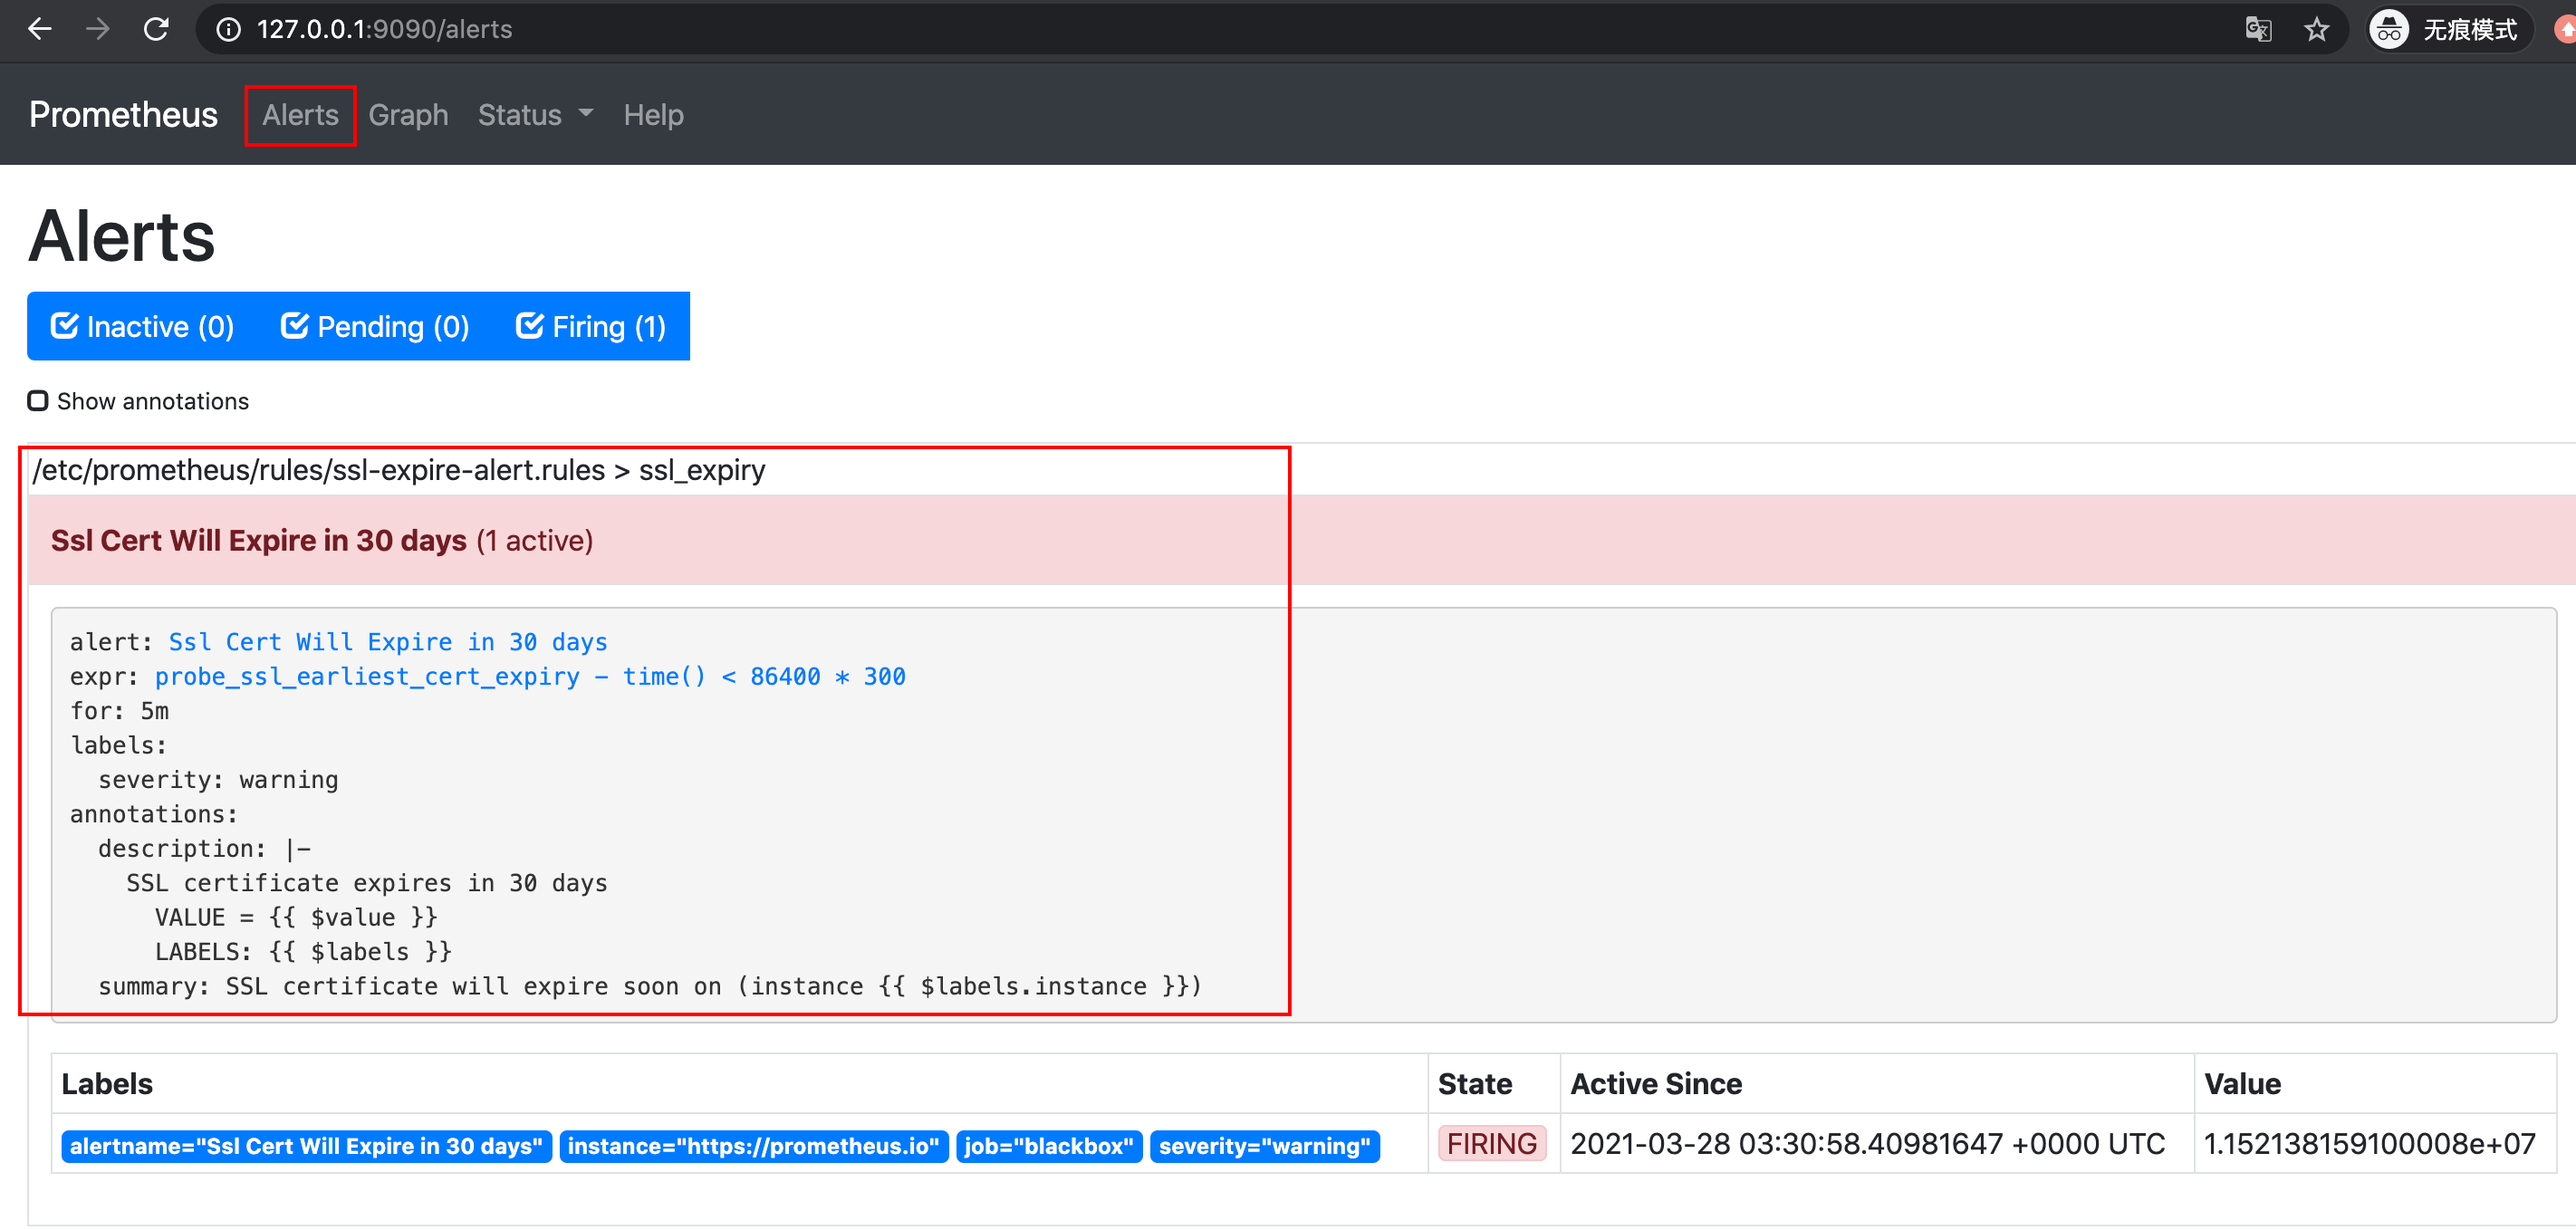
- alert: Ssl Cert Will Expire in 30 days
expr: probe_ssl_earliest_cert_expiry - time() < 86400 * 300
for: 5m
labels:
severity: warning
annotations:
summary: "SSL certificate will expire soon on (instance {{ $labels.instance }})"
description: "SSL certificate expires in 30 days\n VALUE = {{ $value }}\n LABELS: {{ $labels }}"
prometheus加载配置文件
/etc/prometheus/rules $ kill -1 1
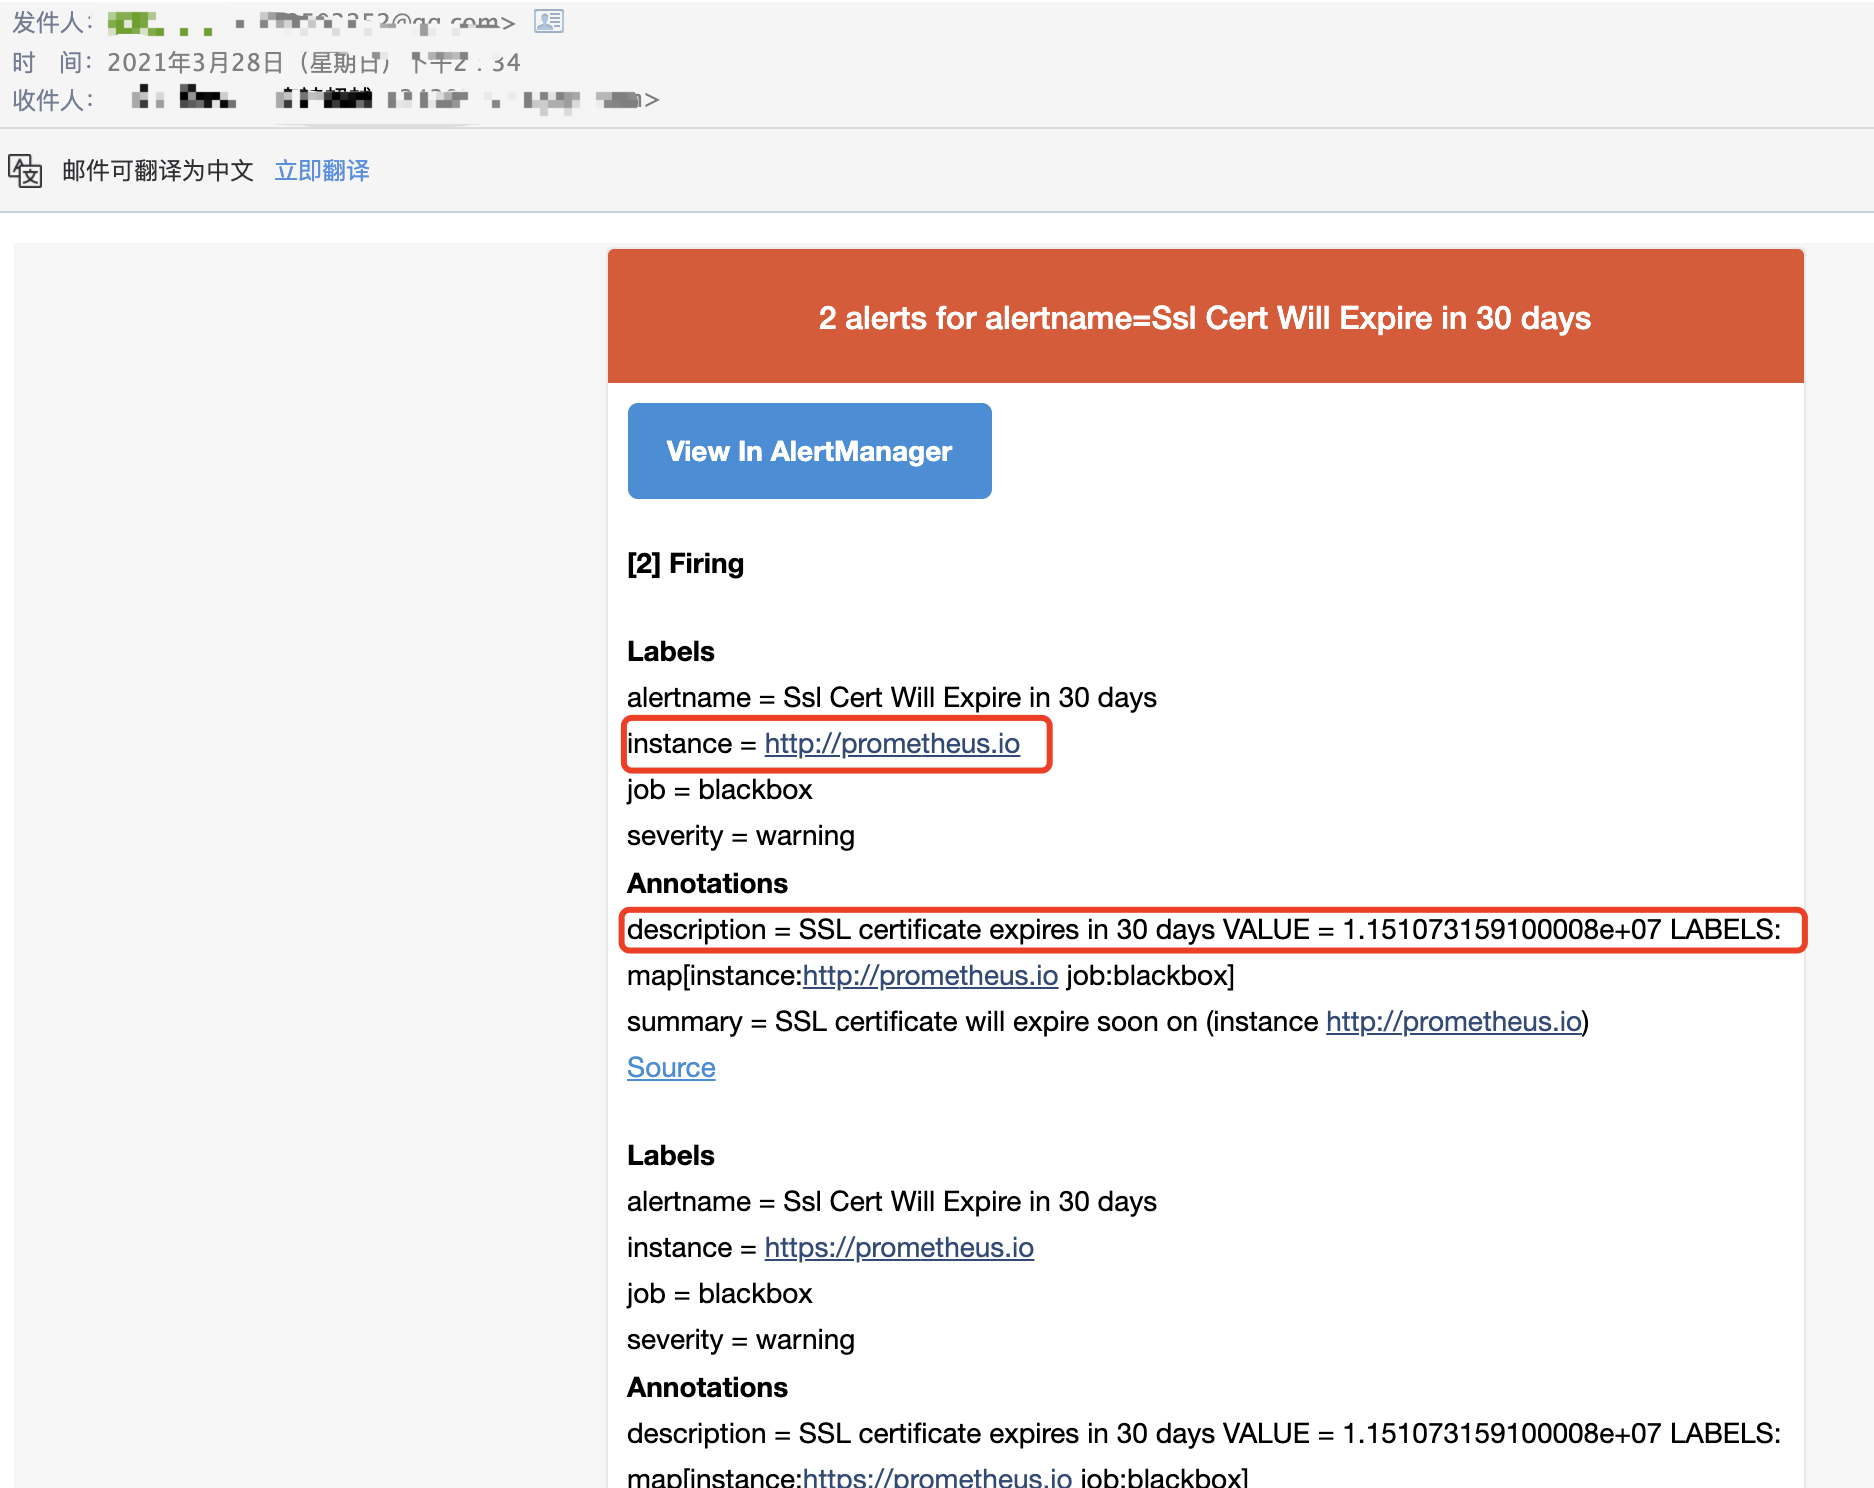
去prometheus界面查看告警,已经有了
八、配置alertmanager邮件告警
部署alertmanager,配置文件是默认的,没有改
/alertmanager $ cat /etc/alertmanager/alertmanager.yml
global:
  resolve_timeout: 5m

route:
  group_by: ['alertname']
  group_wait: 10s
  group_interval: 10s
  repeat_interval: 1h
  receiver: 'web.hook'
receivers:
- name: 'web.hook'
  webhook_configs:
  - url: 'http://127.0.0.1:5001/'
inhibit_rules:
  - source_match:
      severity: 'critical'
    target_match:
      severity: 'warning'
    equal: ['alertname', 'dev', 'instance']
➜ alertmanager docker run --name alertmanager -d -v $(pwd)/alertmanager.yml:/etc/alertmanager/alertmanager.yml -p 9093:9093 prom/alertmanager:v0.21.0
网页访问测试:
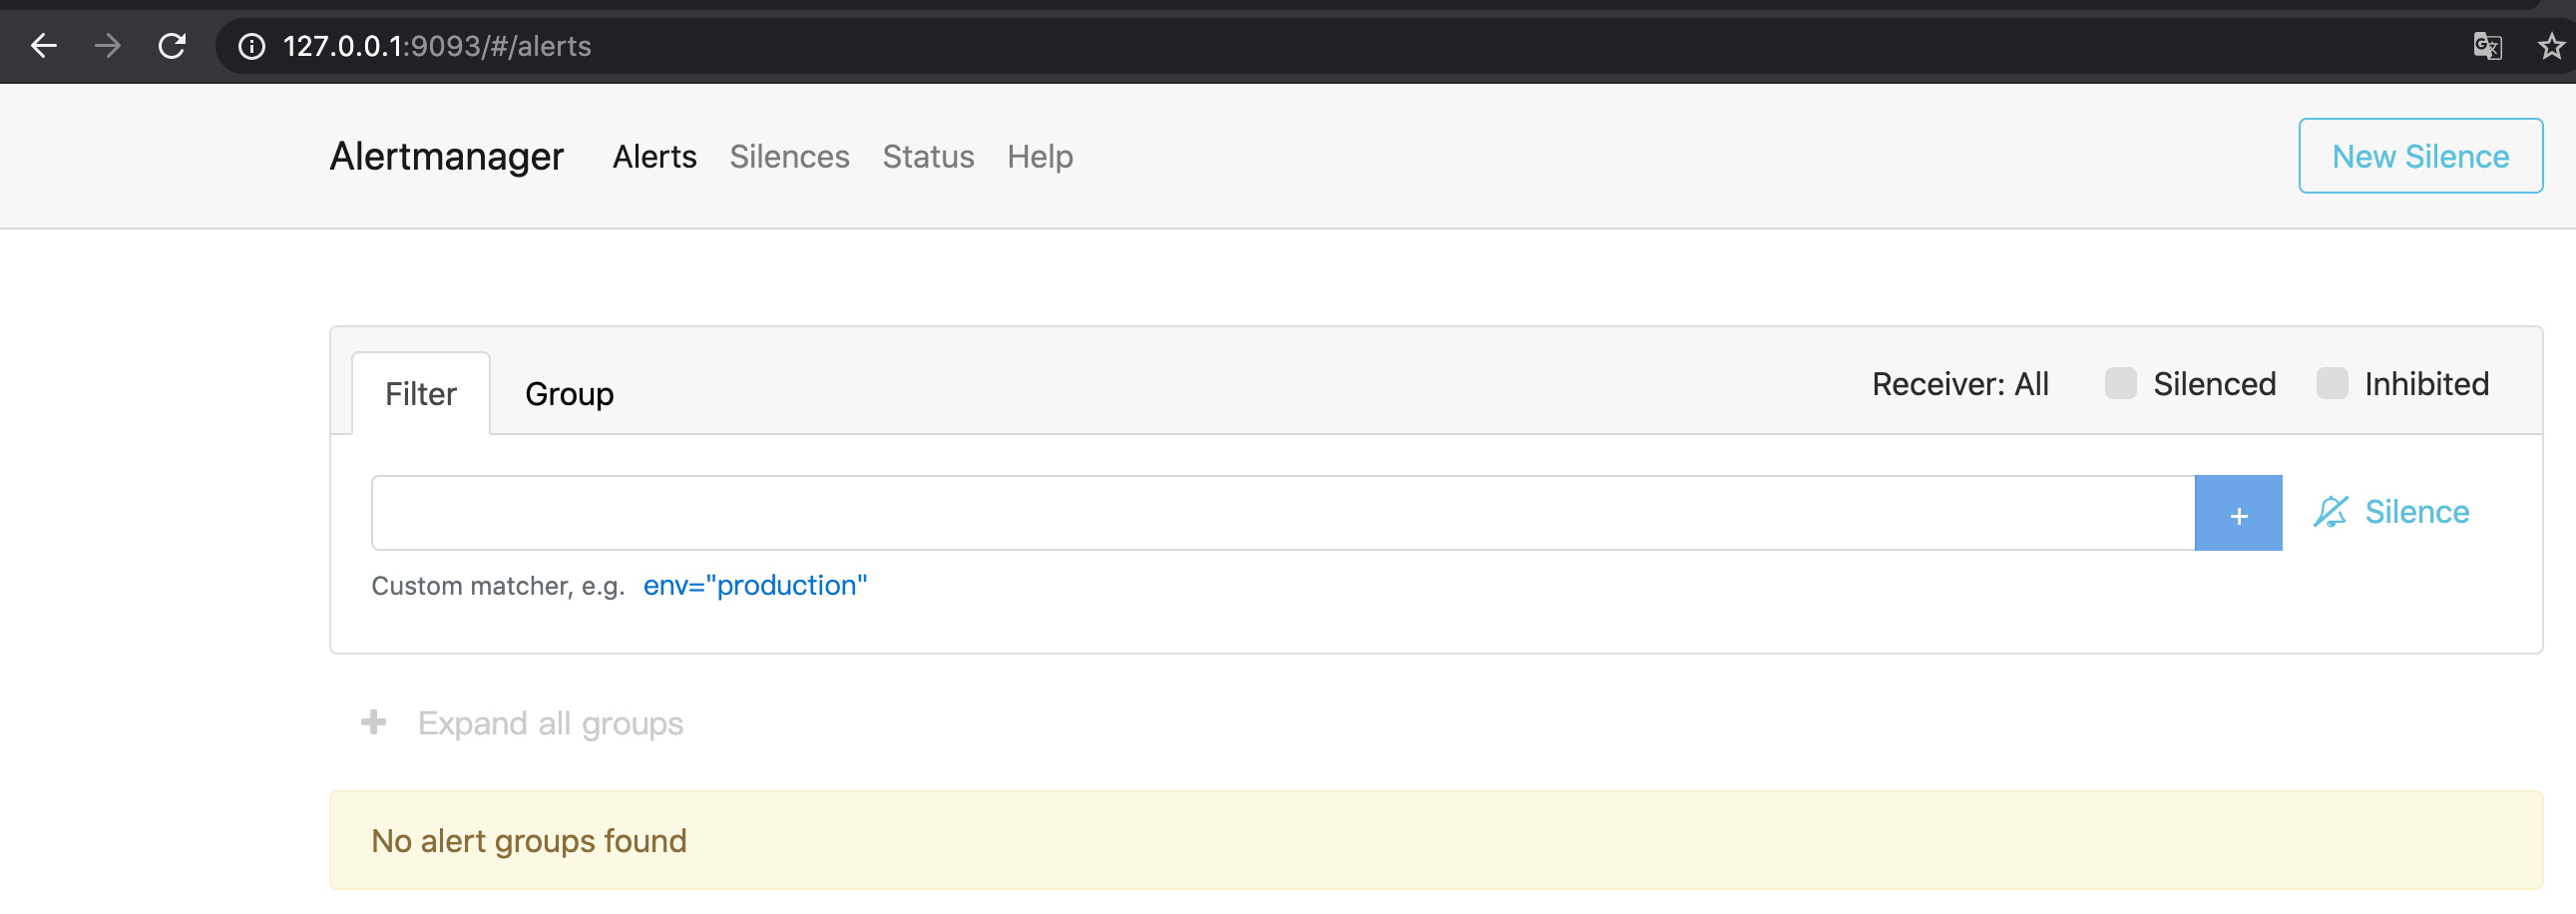
关联prometheus和alertmanager,此时需要修改prometheus.yml,添加alertmanager配置
/prometheus $ cat /etc/prometheus/prometheus.yml
alerting:
  alertmanagers:
  - static_configs:
    - targets:
      - 172.17.0.7:9093
加载prometheus配置
/prometheus $ kill -1 1
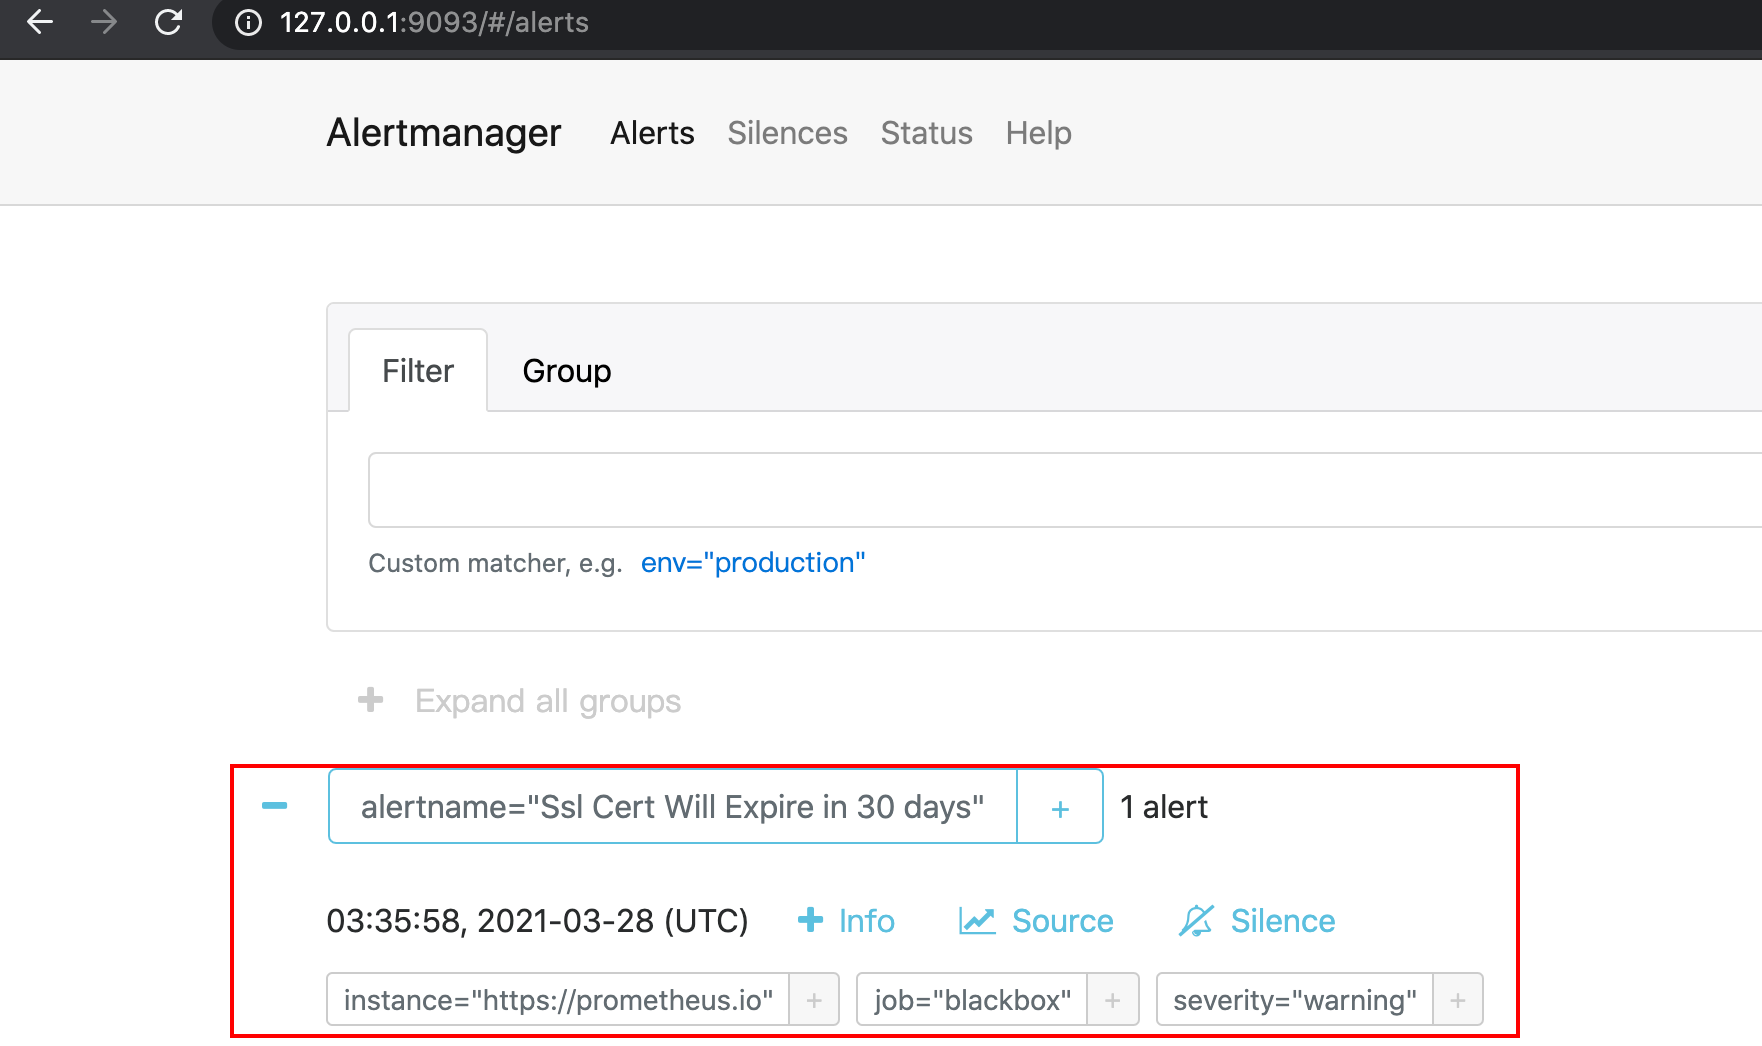
刷新alertmanager页面,发现告警已经过来了
修改alertmanager配置文件,配置邮件告警:
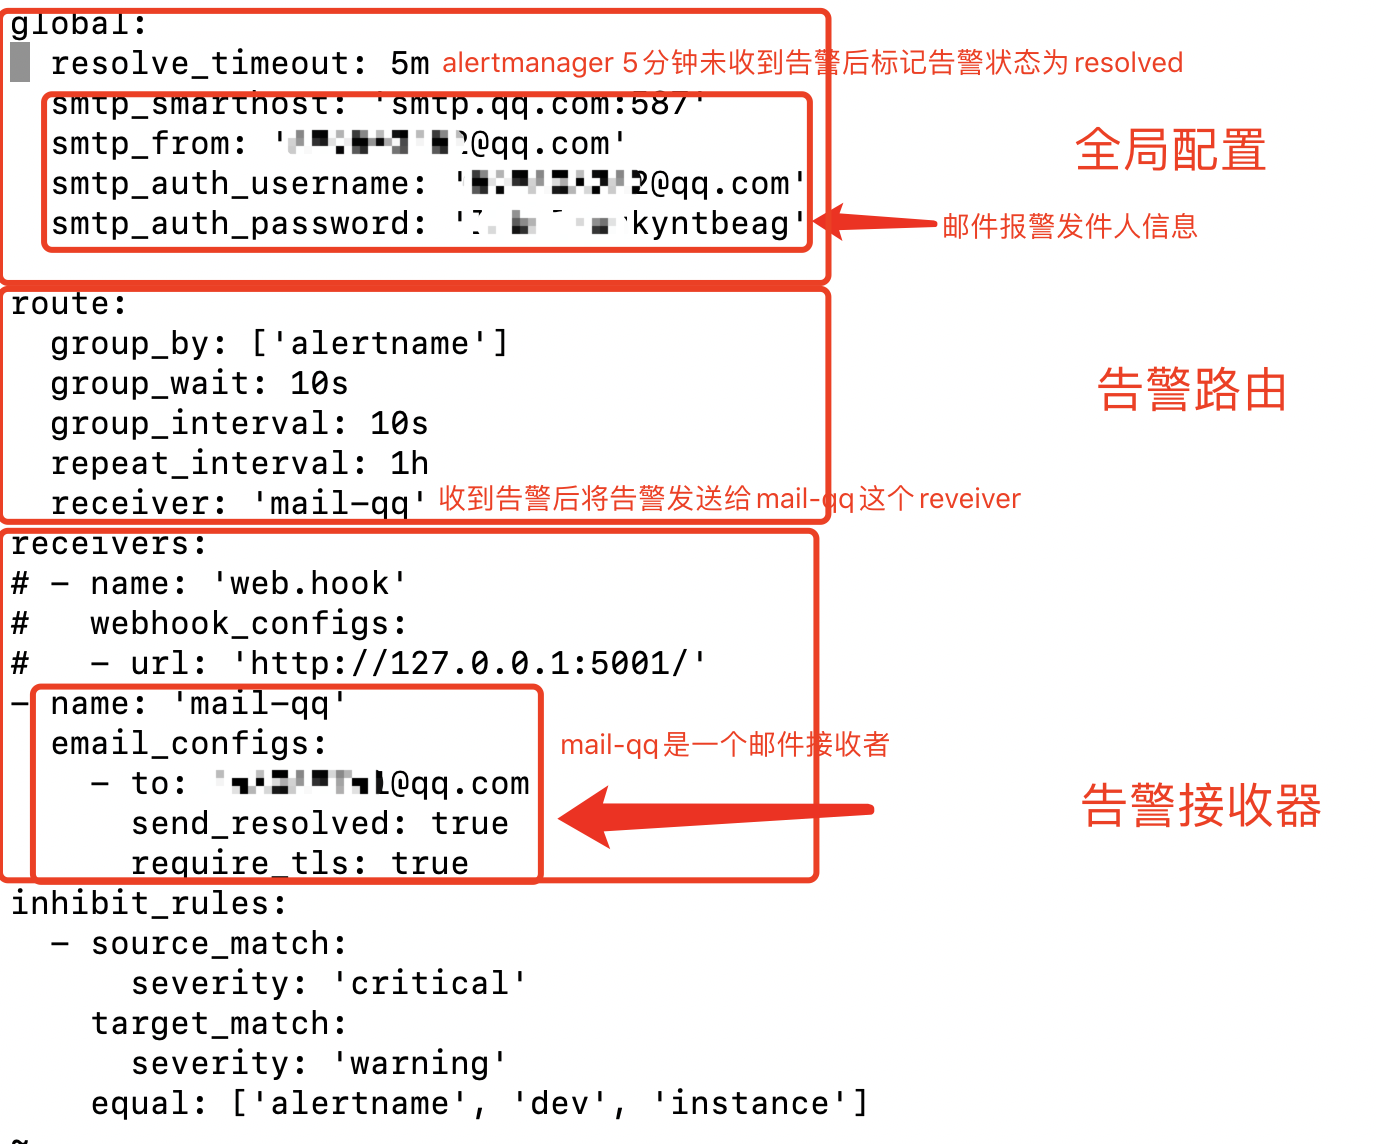
alertmanager重载配置文件:
/alertmanager $ kill -1 1
查看邮箱有没有收到邮件(如果没收到的话要看下alertmanager的日志有什么报错,比如smtp服务器连不上,或者配置文件某一行格式不对)