docker部署grafana并展示zabbix监控
为的是更绚丽的界面,grafana仅仅是展示用,不会修改zabbix数据
grafana需要连接 zabbix server和mysql数据库
条件有限,就用tomcat这个机器做grafana,下面仅仅是测试用
一、安装docker
[root@tomcat1 ~]# curl -sSL https://gitee.com/uscwifi/scripts/raw/master/docker_ubuntu_install.sh | bash
#修改docker的service文件,打开FORWARD
[root@tomcat1 ~]# vim /lib/systemd/system/docker.service
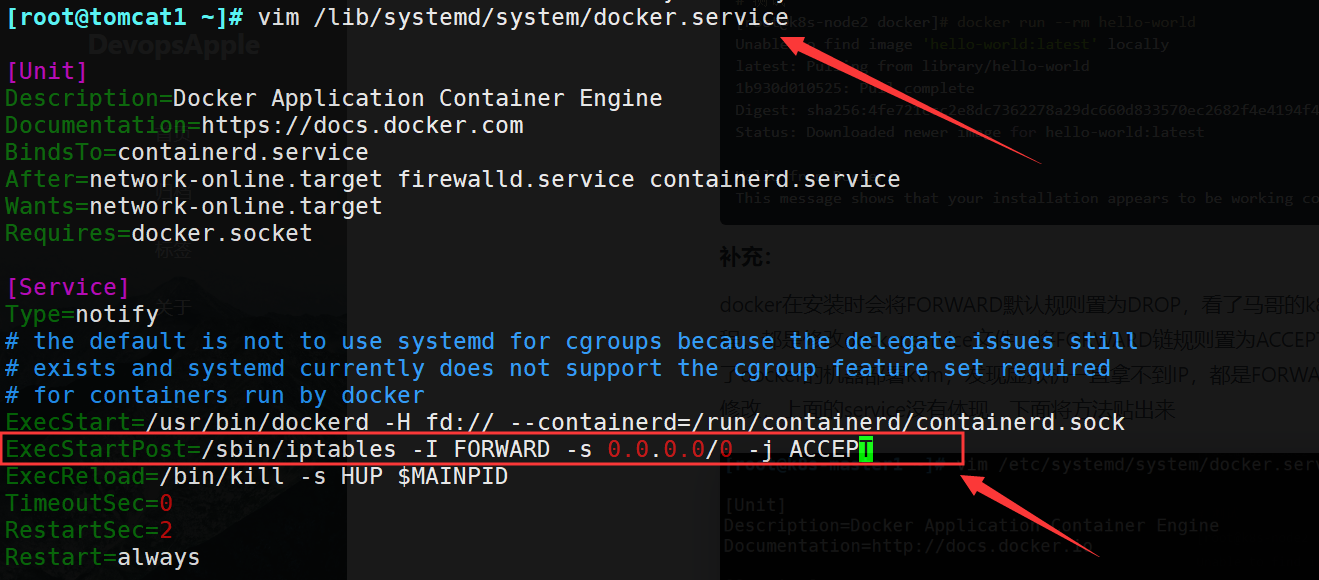
[root@tomcat1 ~]# systemctl daemon-reload
[root@tomcat1 ~]# systemctl daemon-reload
[root@tomcat1 ~]# systemctl restart docker
[root@tomcat1 ~]# iptables -vnL FORWARD
Chain FORWARD (policy DROP 0 packets, 0 bytes)
 pkts bytes target     prot opt in     out     source               destination
    0     0 ACCEPT     all  --  *      *       0.0.0.0/0            0.0.0.0/0
二、部署grafana
[root@tomcat1 ~]# docker run -d --name=grafana -p 3000:3000 grafana/grafana
三、安装zabbix插件
参考:https://grafana.com/grafana/plugins/alexanderzobnin-zabbix-app
[root@tomcat1 ~]# docker exec -it grafana grafana-cli plugins install alexanderzobnin-zabbix-app
installing alexanderzobnin-zabbix-app @ 3.10.4
from: https://grafana.com/api/plugins/alexanderzobnin-zabbix-app/versions/3.10.4/download
into: /var/lib/grafana/plugins

✔ Installed alexanderzobnin-zabbix-app successfully

Restart grafana after installing plugins . <service grafana-server restart>
[root@tomcat1 ~]# docker restart grafana
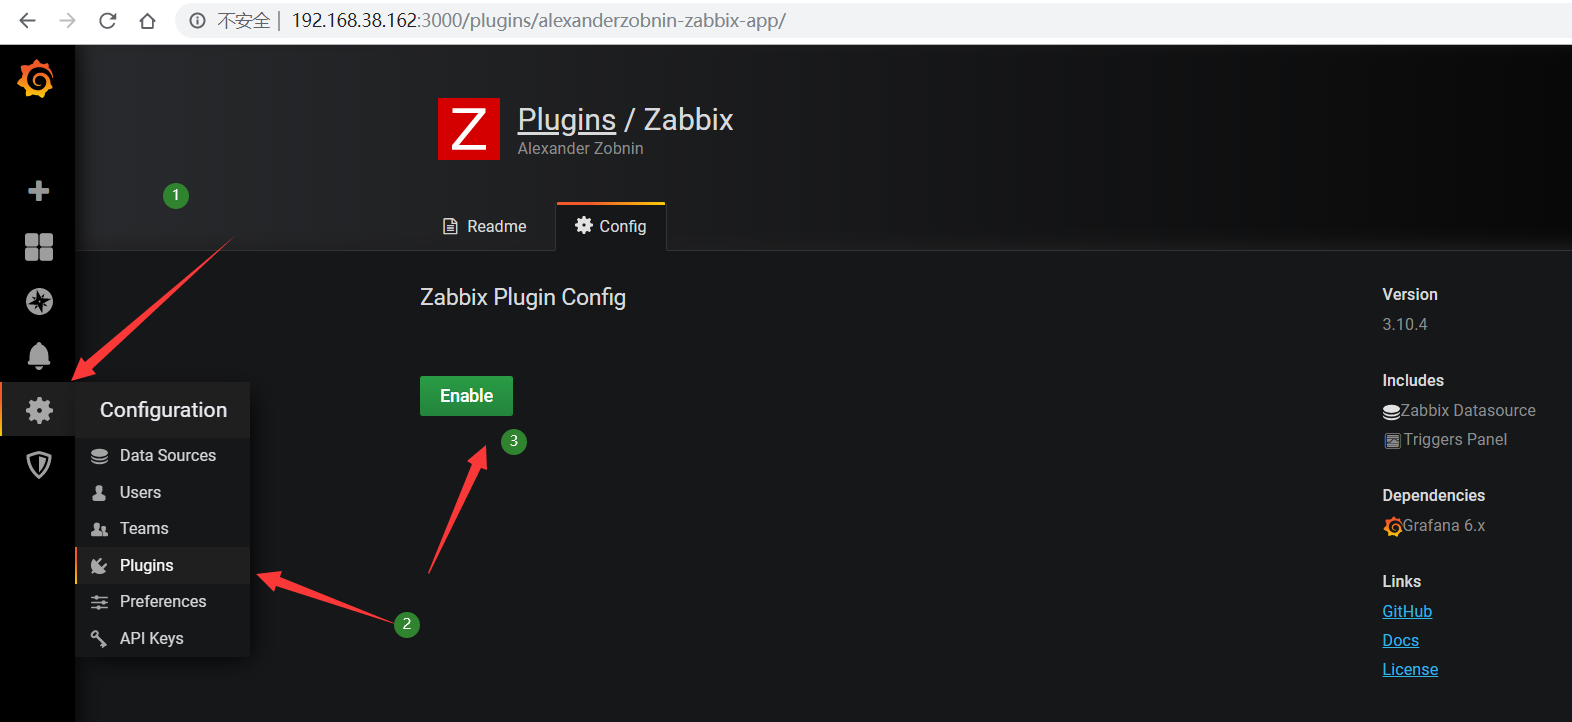
四、启用zabbix插件
http://192.168.38.162:3000/login
默认用户名密码:admin/admin
左边小齿轮-> plugins ->zabbix图标 -> enable
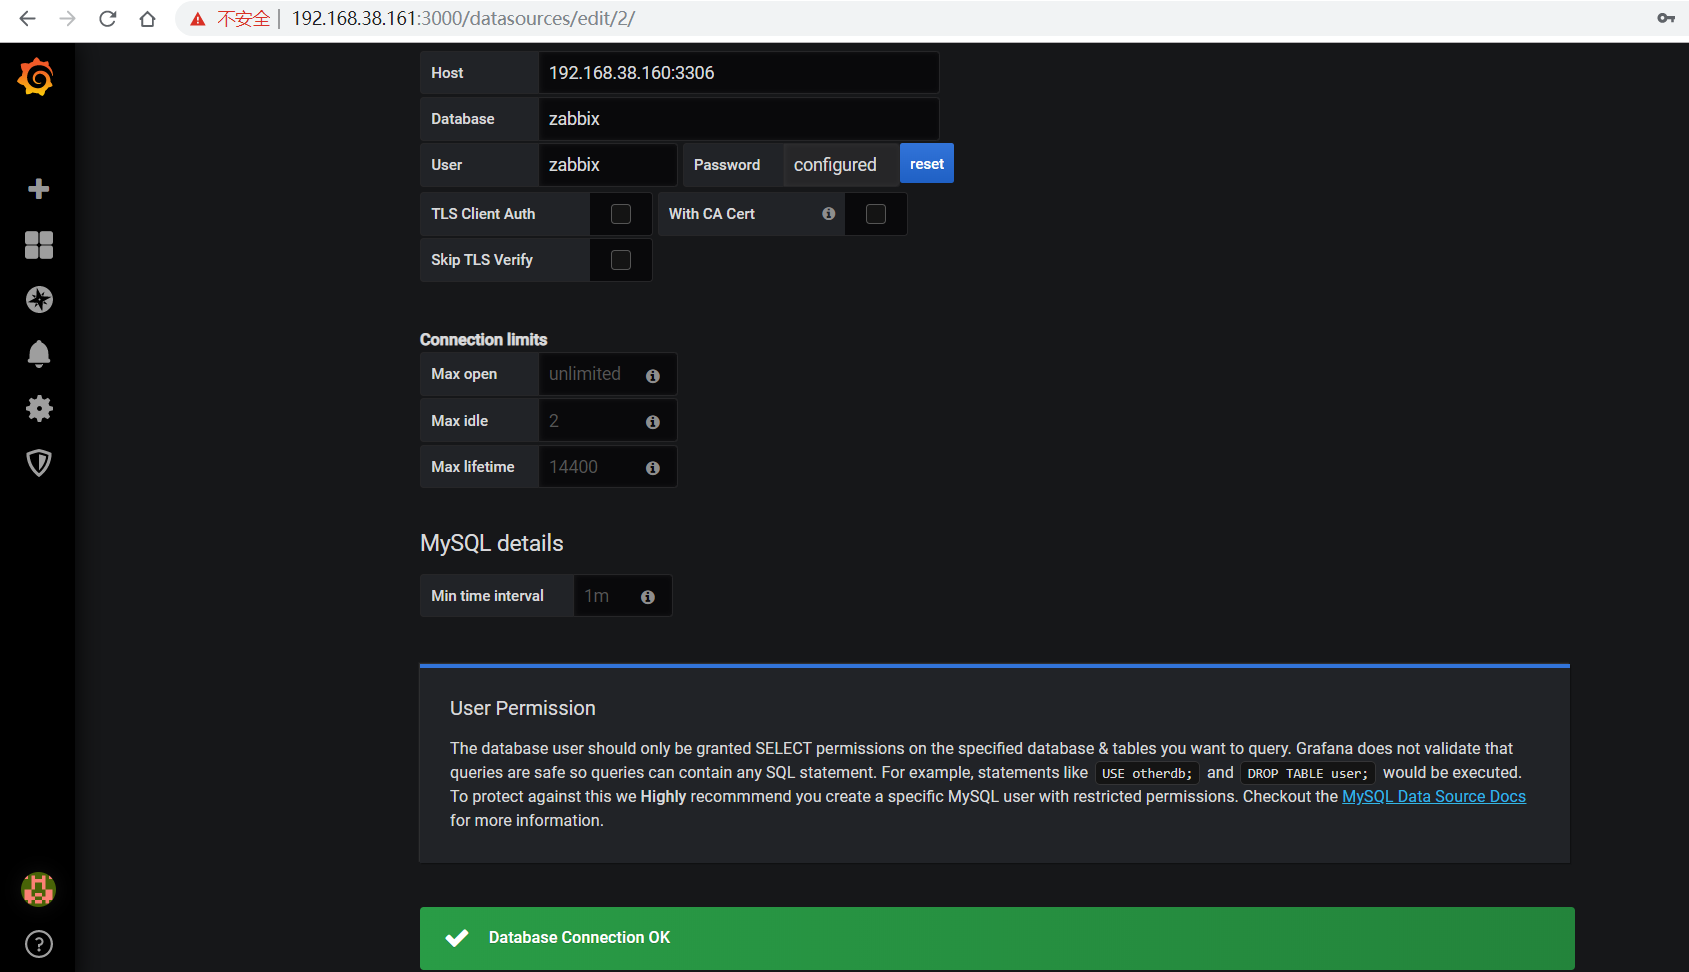
五、添加mysql数据源
左边小齿轮-> data sources ->add data sources ->mysql图标
数据库没授权
mysql> grant all on zabbix.* to 'zabbix'@'192.168.38.%' identified by '123456';
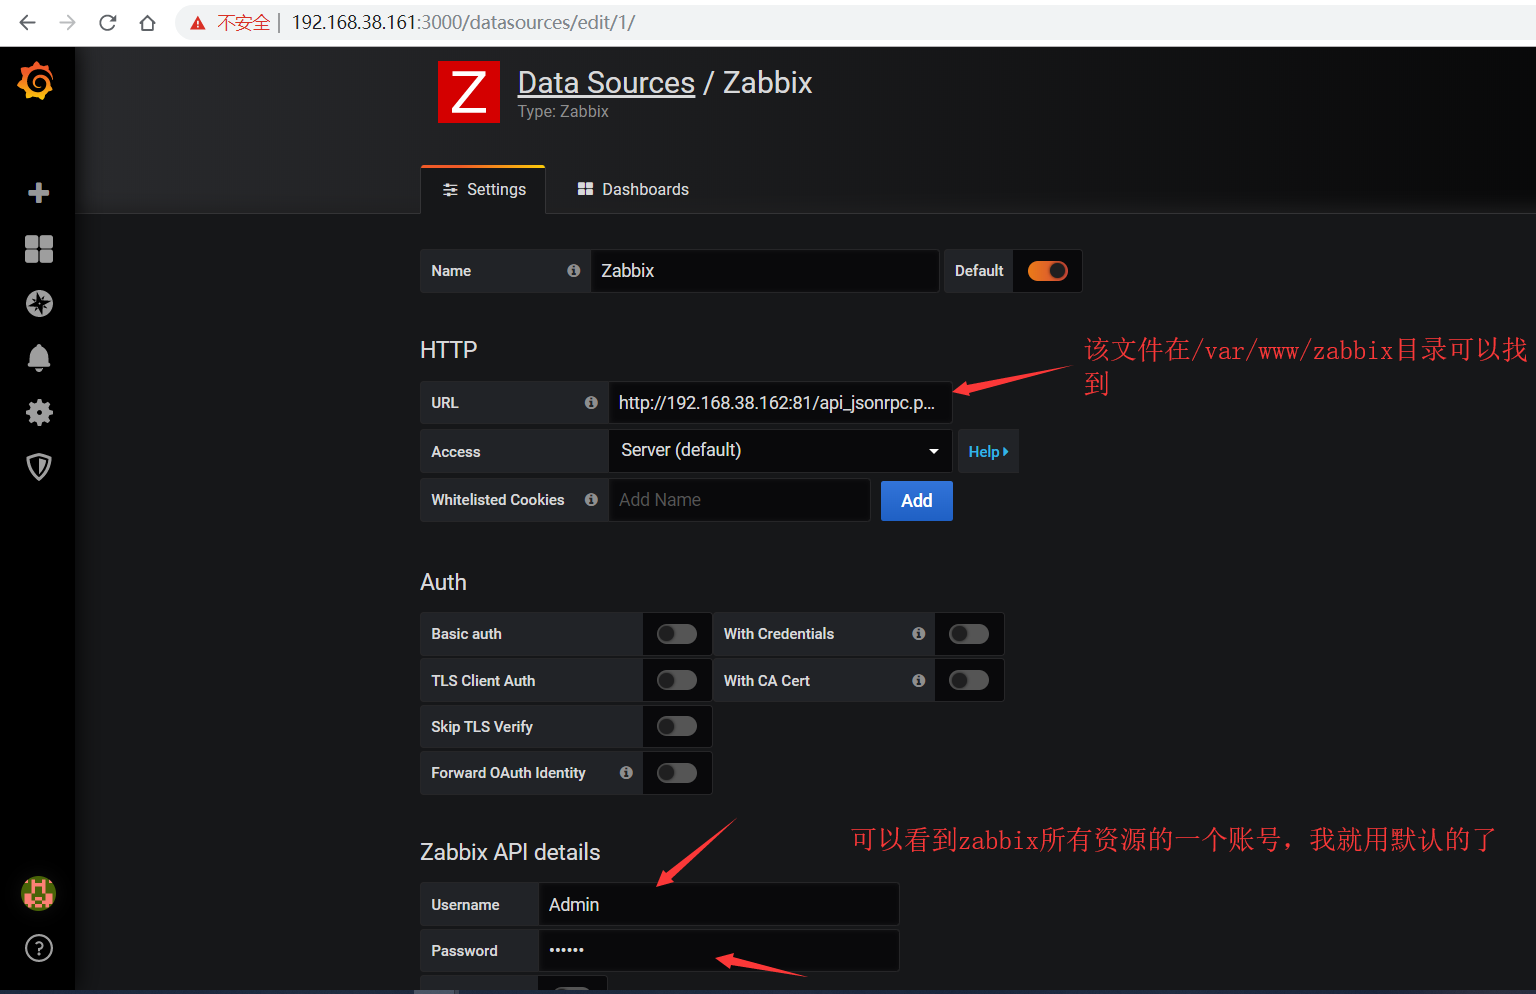
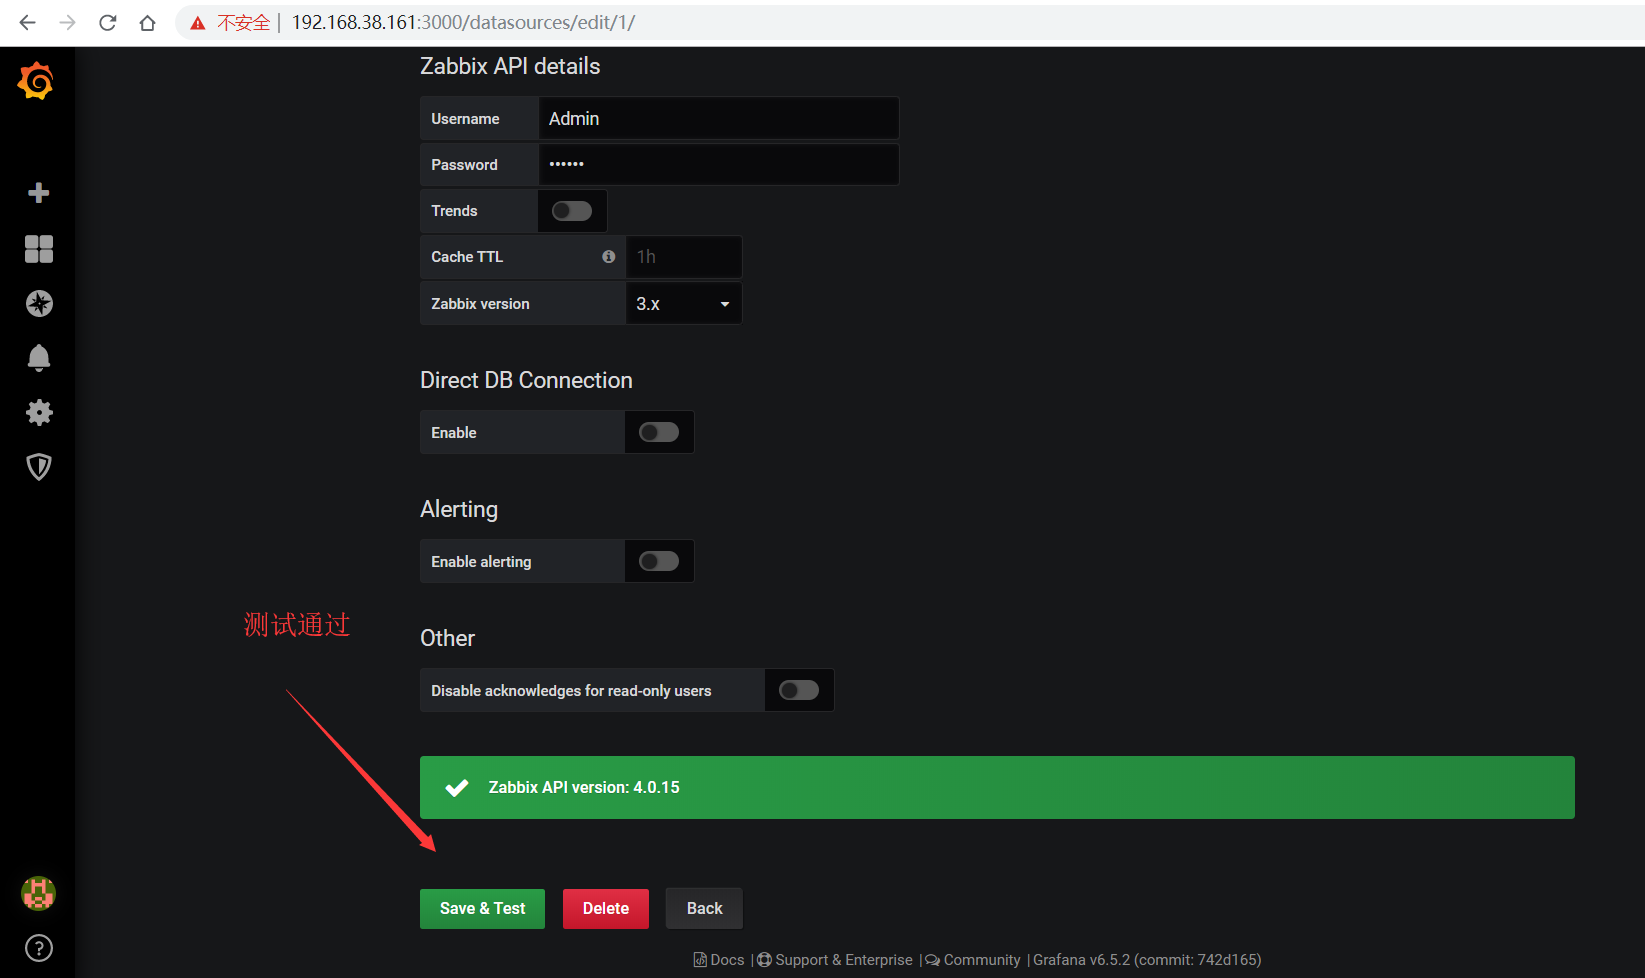
六、添加zabbix数据源
左边小齿轮->Data Sources -> Add data source -> Others ->zabbix
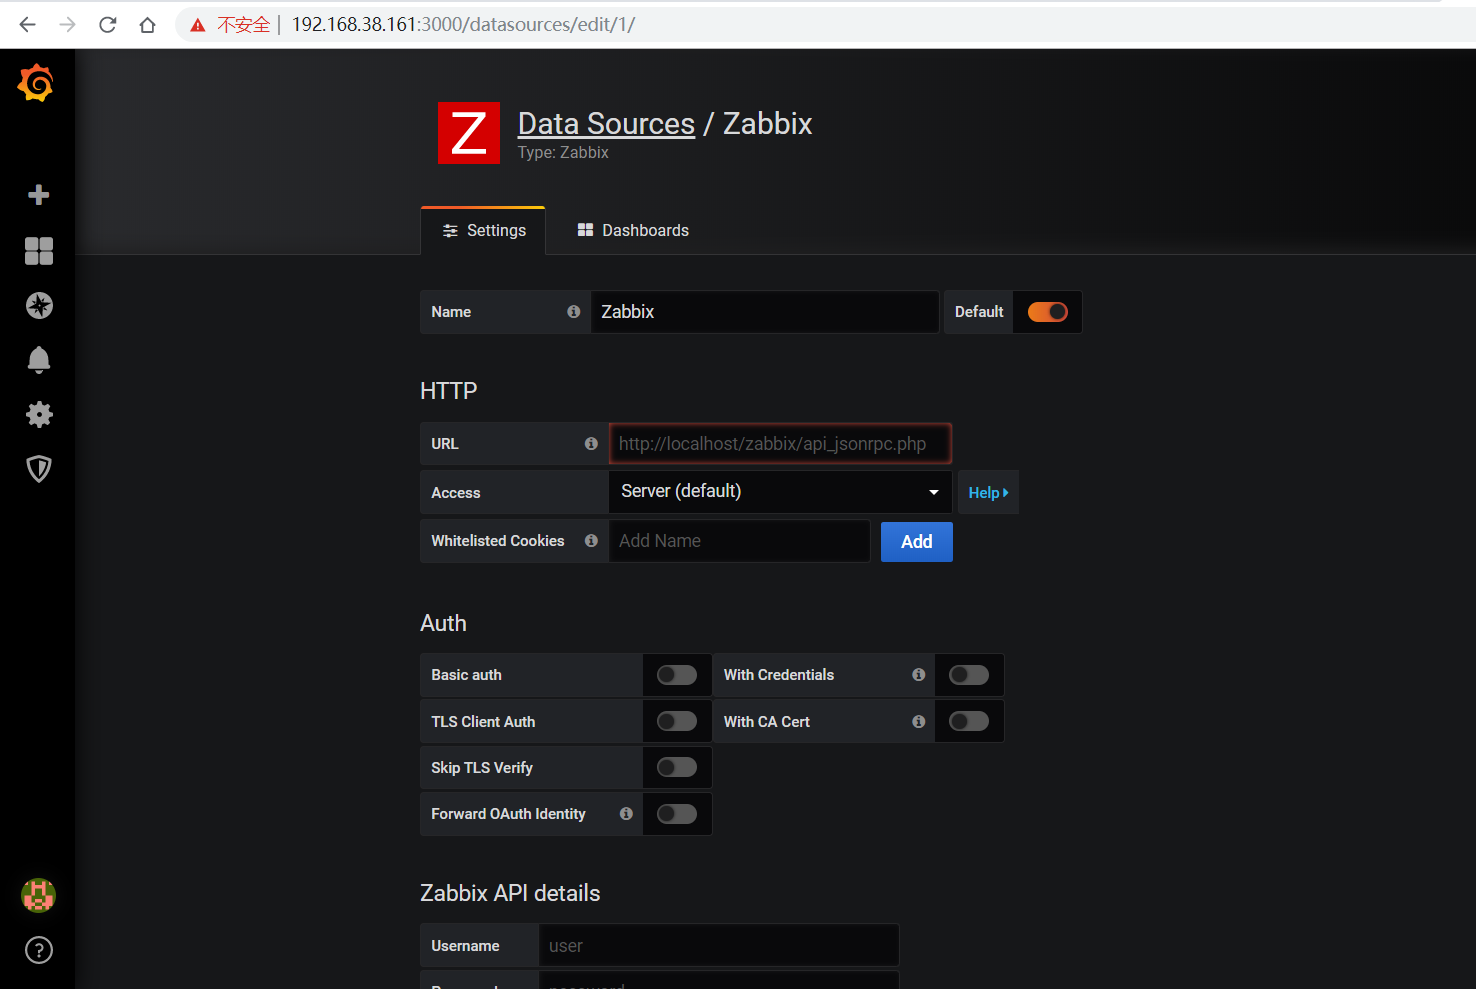
url填:http://192.168.38.162:81/api_jsonrpc.php 根据自己的情况填
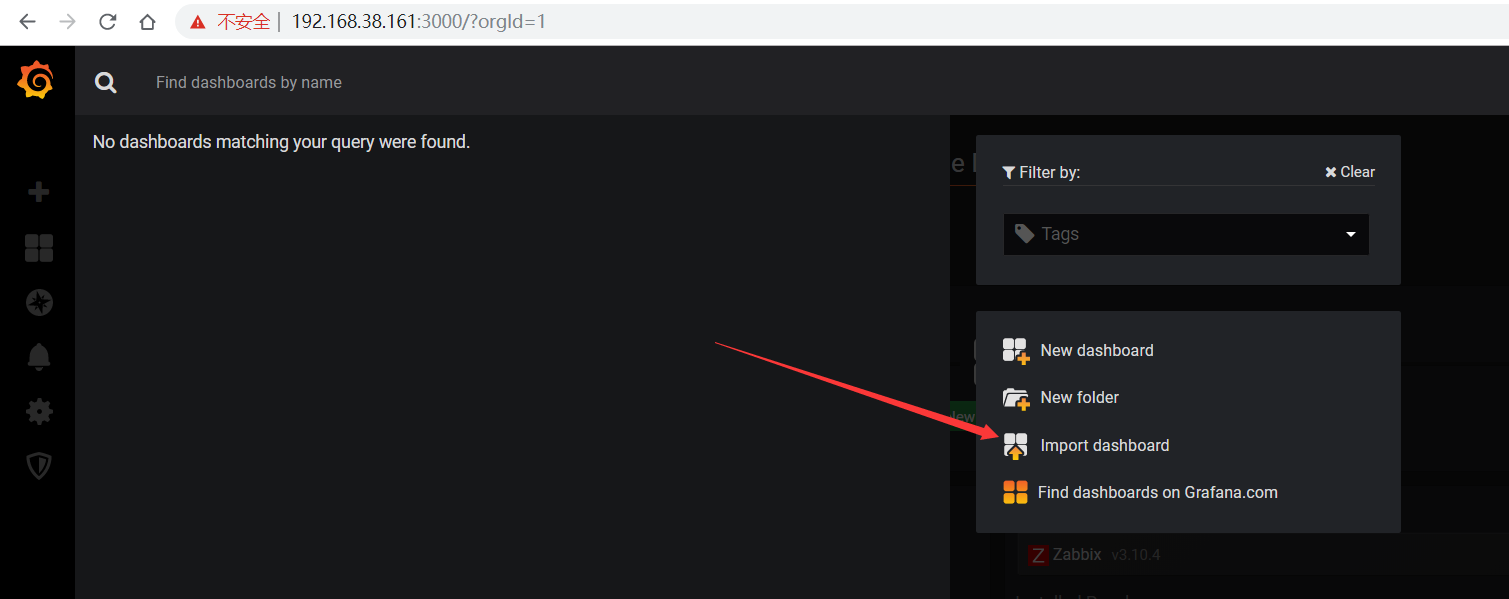
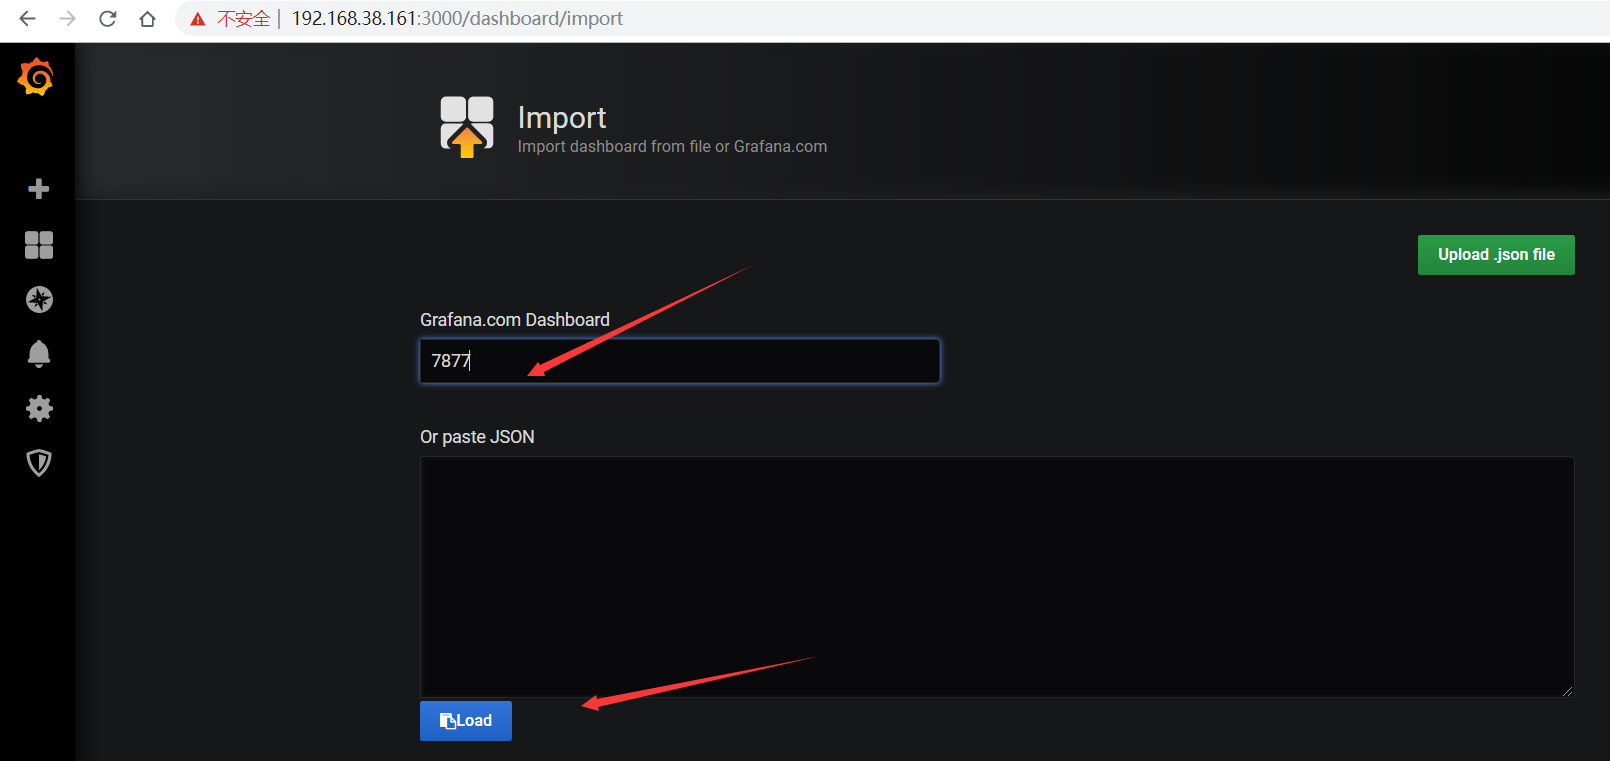
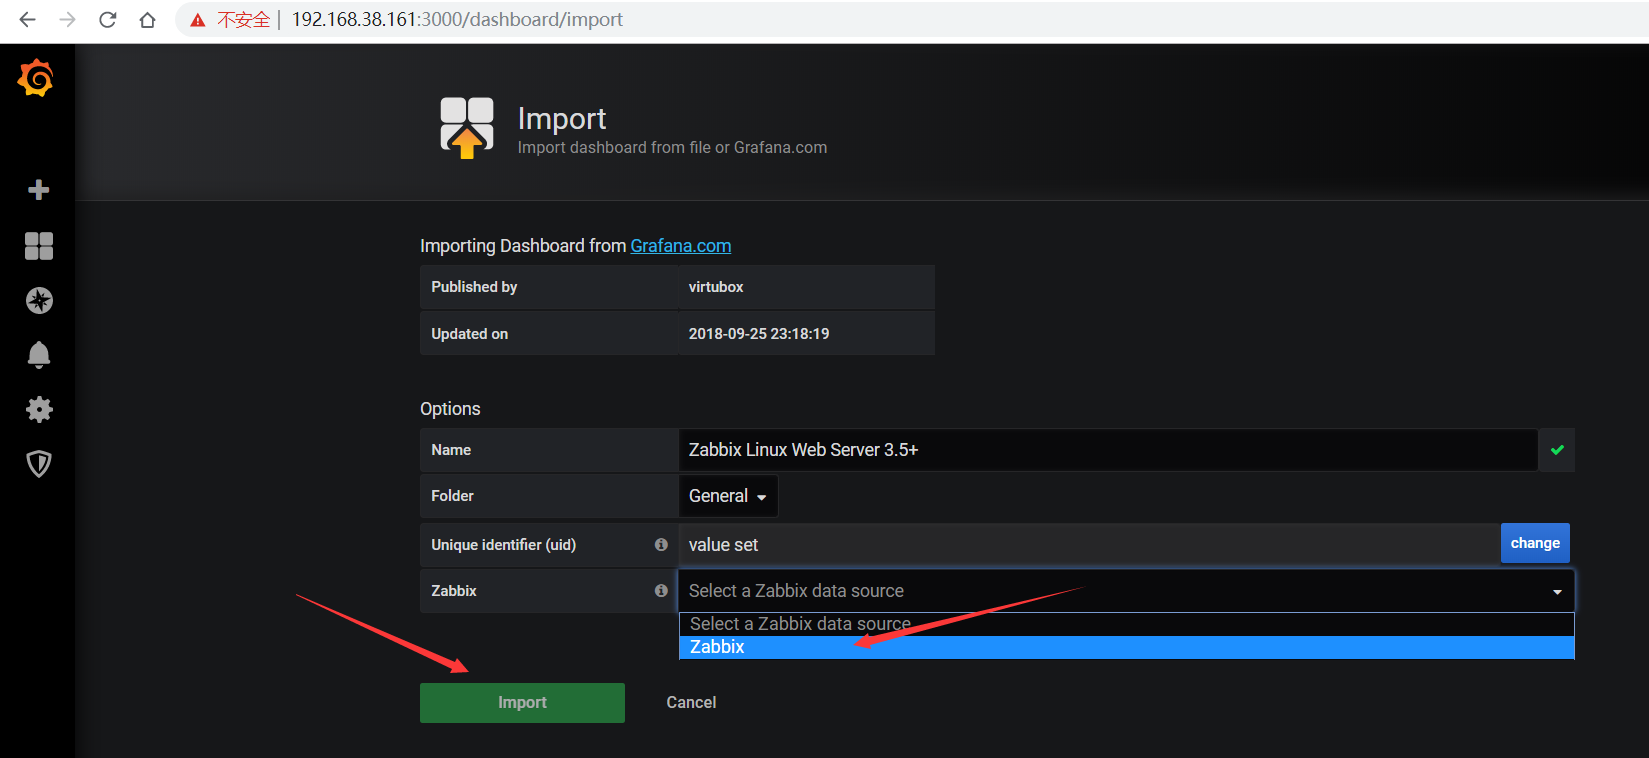
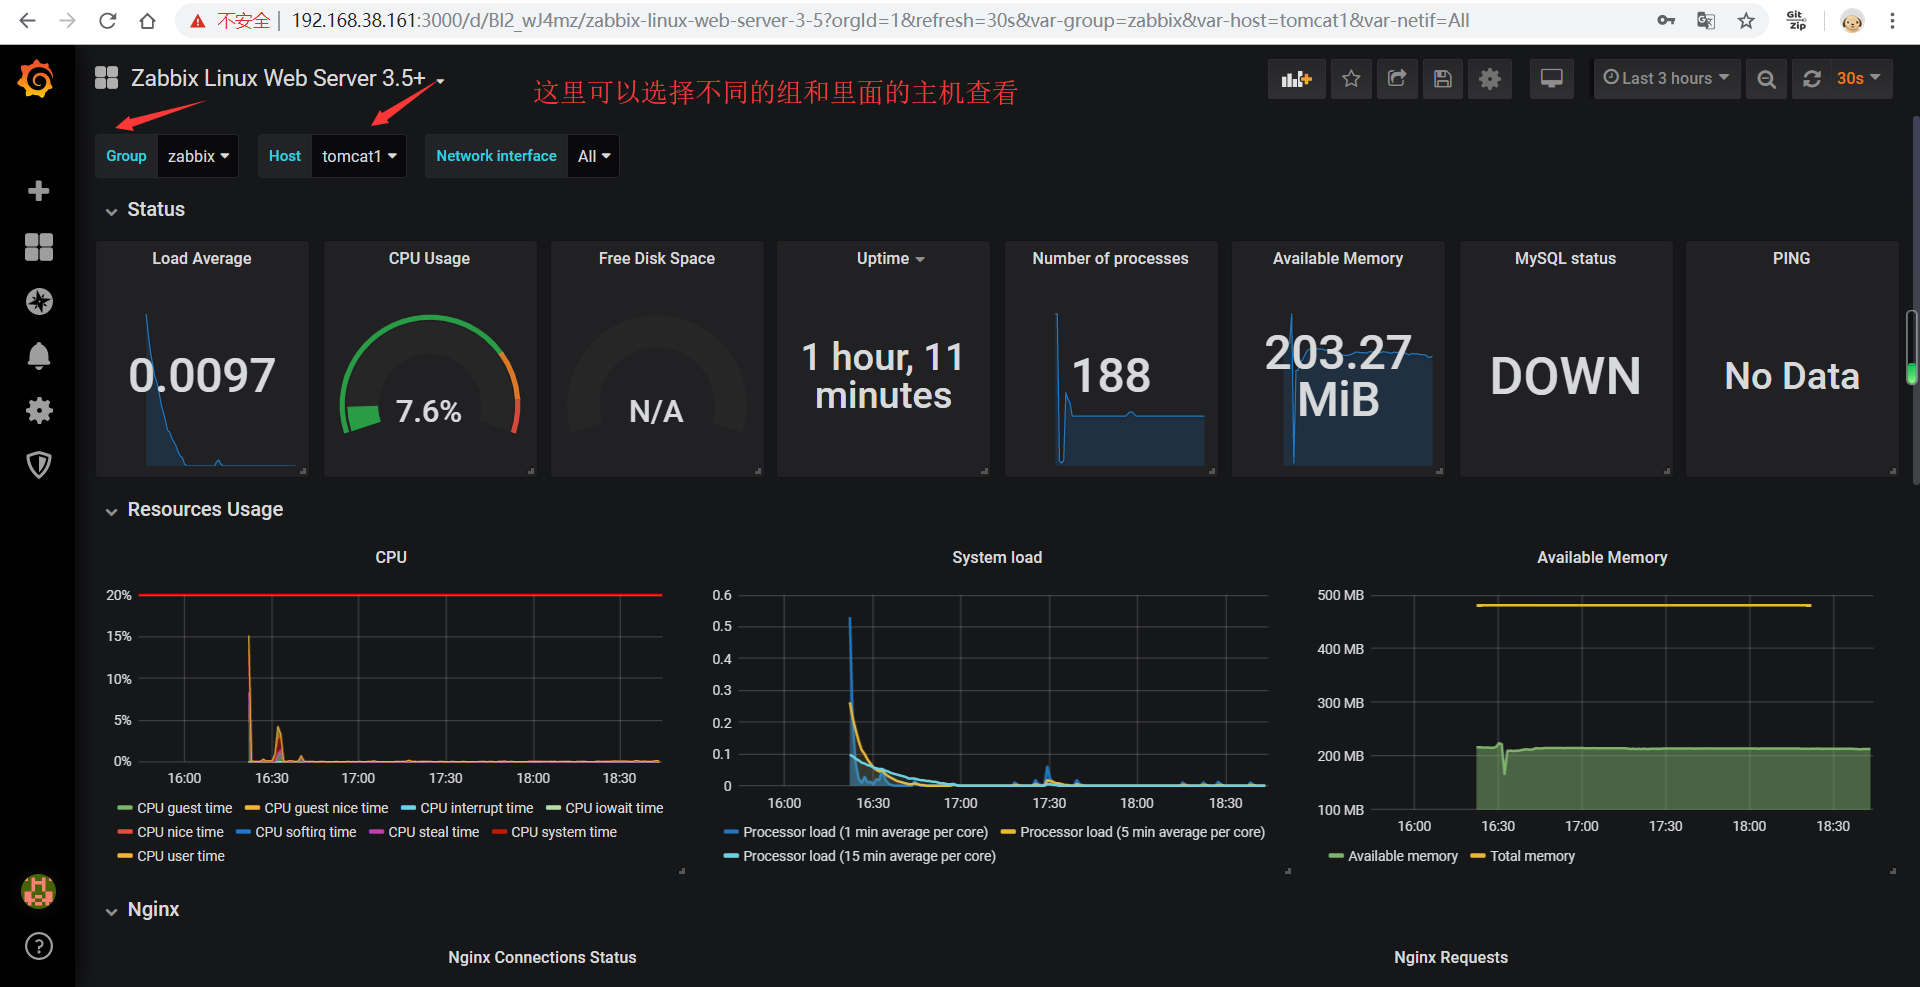
七、添加dashboard
可以自己添加dashboard,我这里直接导入别人的模版了,7877模版不错