helm部署prometheus
参考:https://artifacthub.io/packages/helm/prometheus-community/prometheus
一、拉取prometheus的chart
#添加chart库
[root@k8s ~]# helm repo add prometheus-community https://prometheus-community.github.io/helm-charts
[root@k8s ~]# helm repo add kube-state-metrics https://kubernetes.github.io/kube-state-metrics
#更新chart库信息
[root@k8s ~]# helm repo update
#下载远程包到本地
[root@k8s ~]# helm fetch prometheus-community/prometheus --untar
修改prometheus 变量
[root@k8s ~]# cd prometheus/
[root@k8s prometheus]# vim values.yaml
-
1、alertmanager配置持久化
alertmanager: enabled: true ingress: enabled: false persistentVolume: enabled: true storageClass: "managed-nfs-storage" -
2、node-exporter的9100端口改为nodeport
nodeExporter: enabled: true service: servicePort: 9100 type: NodePort -
3、prometheus配置,关闭ingress,持久化配置,使用nodePort,添加harbor监控
server: enabled: true ingress: enabled: false persistentVolume: enabled: true storageClass: "managed-nfs-storage" service: servicePort: 9090 type: NodePort nodePort: 32299 #指定端口 -
4、prometheus配置文件
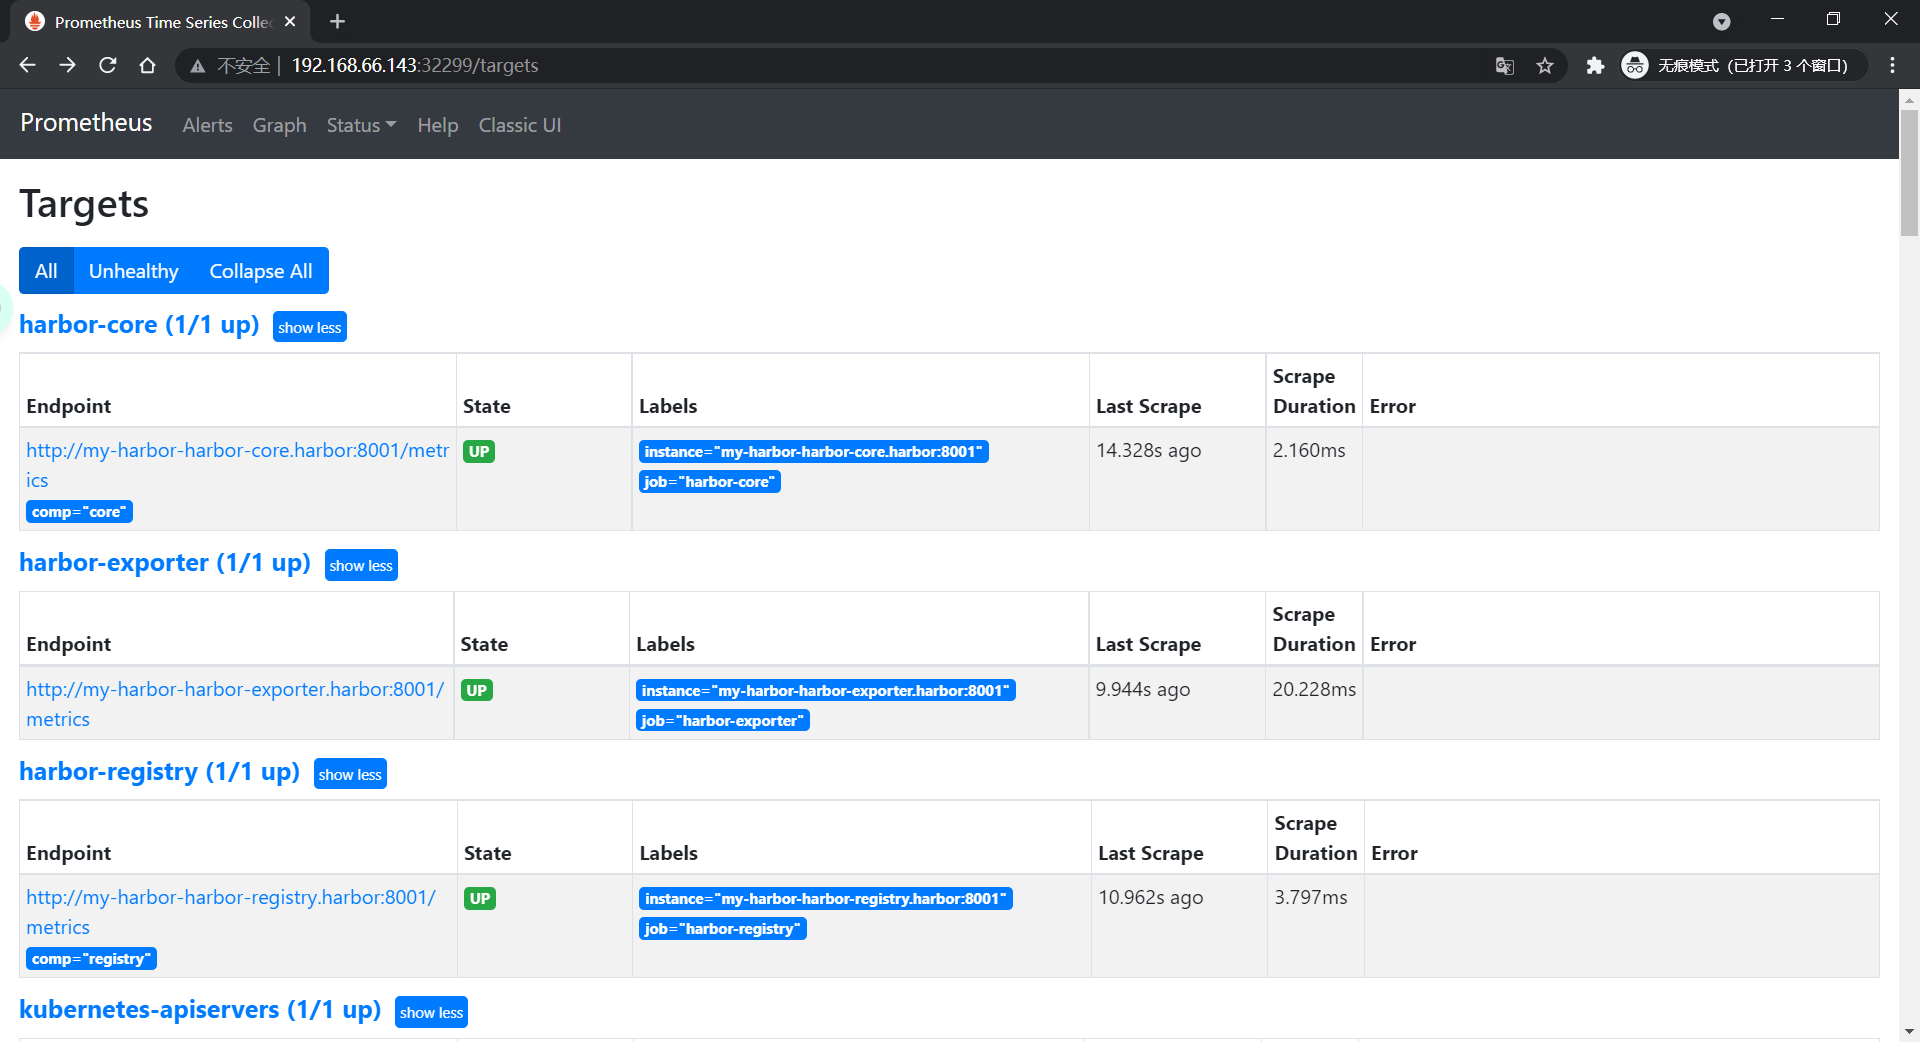
serverFiles:
  prometheus.yml:
    scrape_configs:
      - job_name: 'harbor-exporter'
        scrape_interval: 20s
        static_configs:
          # Scrape metrics from the Harbor exporter component
          - targets: ['my-harbor-harbor-exporter.harbor:8001']
      - job_name: 'harbor-core'
        scrape_interval: 20s
        params:
          # Scrape metrics from the Harbor core component
          comp: ['core']
        static_configs:
          - targets: ['my-harbor-harbor-core.harbor:8001']

      - job_name: 'harbor-registry'
        scrape_interval: 20s
        params:
          # Scrape metrics from the Harbor registry component
          comp: ['registry']
        static_configs:
          - targets: ['my-harbor-harbor-registry.harbor:8001']
二、安装prometheus
[root@k8s ~]# kubectl create ns prometheus
[root@k8s prometheus]# helm install -f values.yaml my-prometheus . -n prometheus
WARNING: Kubernetes configuration file is group-readable. This is insecure. Location: /root/.kube/config
WARNING: Kubernetes configuration file is world-readable. This is insecure. Location: /root/.kube/config
NAME: my-prometheus
LAST DEPLOYED: Sat May 29 02:28:21 2021
NAMESPACE: prometheus
STATUS: deployed
REVISION: 1
TEST SUITE: None
NOTES:
The Prometheus server can be accessed via port 9100 on the following DNS name from within your cluster:
my-prometheus-server.prometheus.svc.cluster.local


Get the Prometheus server URL by running these commands in the same shell:
  export NODE_PORT=$(kubectl get --namespace prometheus -o jsonpath="{.spec.ports[0].nodePort}" services my-prometheus-server)
  export NODE_IP=$(kubectl get nodes --namespace prometheus -o jsonpath="{.items[0].status.addresses[0].address}")
  echo http://$NODE_IP:$NODE_PORT


The Prometheus alertmanager can be accessed via port 80 on the following DNS name from within your cluster:
my-prometheus-alertmanager.prometheus.svc.cluster.local


Get the Alertmanager URL by running these commands in the same shell:
  export POD_NAME=$(kubectl get pods --namespace prometheus -l "app=prometheus,component=alertmanager" -o jsonpath="{.items[0].metadata.name}")
  kubectl --namespace prometheus port-forward $POD_NAME 9093
#################################################################################
######   WARNING: Pod Security Policy has been moved to a global property.  #####
######            use .Values.podSecurityPolicy.enabled with pod-based      #####
######            annotations                                               #####
######            (e.g. .Values.nodeExporter.podSecurityPolicy.annotations) #####
#################################################################################


The Prometheus PushGateway can be accessed via port 9091 on the following DNS name from within your cluster:
my-prometheus-pushgateway.prometheus.svc.cluster.local


Get the PushGateway URL by running these commands in the same shell:
  export POD_NAME=$(kubectl get pods --namespace prometheus -l "app=prometheus,component=pushgateway" -o jsonpath="{.items[0].metadata.name}")
  kubectl --namespace prometheus port-forward $POD_NAME 9091

For more information on running Prometheus, visit:
https://prometheus.io/
[root@k8s prometheus]# kubectl -n prometheus get po
NAME                                                READY   STATUS    RESTARTS   AGE
my-prometheus-alertmanager-549d688f6b-whx5d         1/2     Running   0          53s
my-prometheus-kube-state-metrics-558bb9b6c9-588nz   1/1     Running   0          54s
my-prometheus-node-exporter-zp9f8                   1/1     Running   0          54s
my-prometheus-pushgateway-c79b96f47-4ml8h           1/1     Running   0          53s
my-prometheus-server-f8b9764bb-x6d57                1/2     Running   0          54s
三、访问prometheus
[root@k8s prometheus]# kubectl get svc -n prometheus
NAME                               TYPE        CLUSTER-IP      EXTERNAL-IP   PORT(S)          AGE
my-prometheus-alertmanager         ClusterIP   10.68.206.192   <none>        80/TCP           2m4s
my-prometheus-kube-state-metrics   ClusterIP   10.68.12.54     <none>        8080/TCP         2m4s
my-prometheus-node-exporter        NodePort    10.68.191.167   <none>        9100:30844/TCP   2m4s
my-prometheus-pushgateway          ClusterIP   10.68.148.213   <none>        9091/TCP         2m4s
my-prometheus-server               NodePort    10.68.205.185   <none>        9100:31966/TCP   2m4s
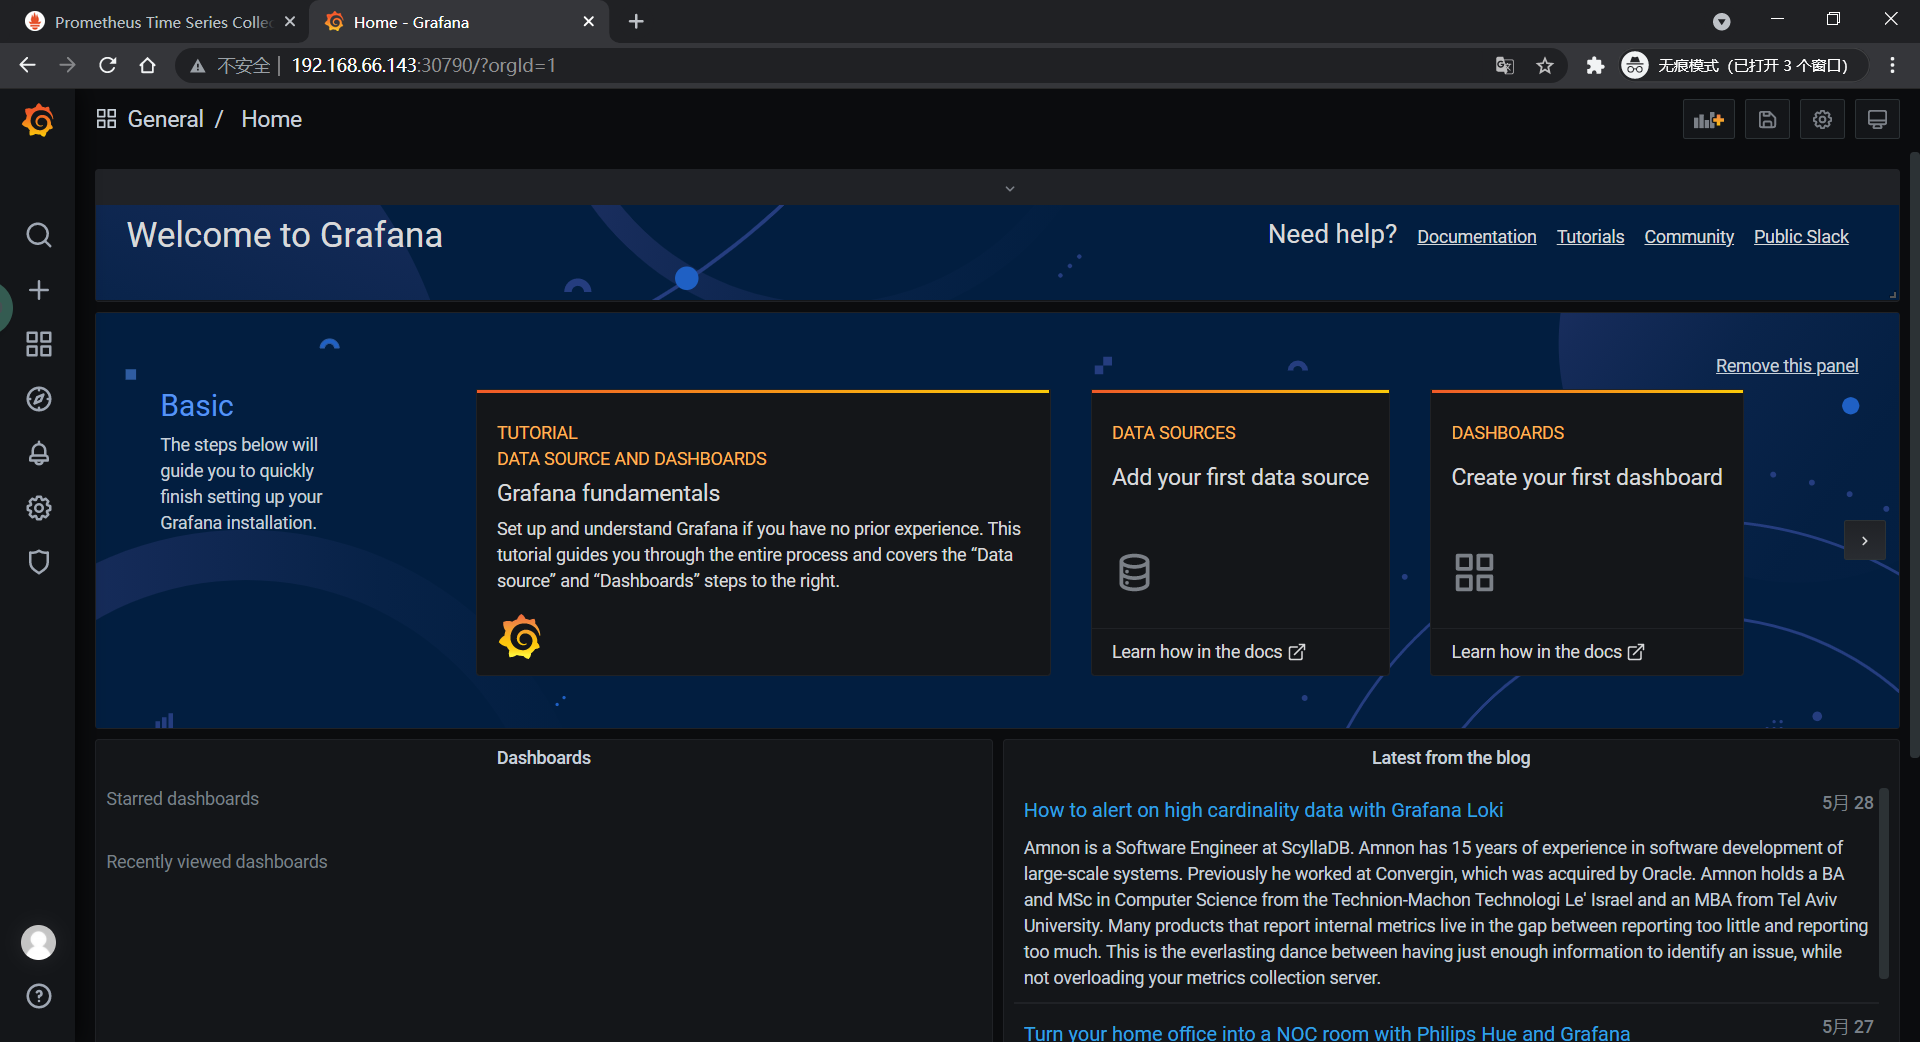
四、安装grafana
https://artifacthub.io/packages/helm/grafana/grafana
[root@k8s ~]# helm repo add grafana https://grafana.github.io/helm-charts
"grafana" has been added to your repositories
[root@k8s ~]# helm repo update
...Successfully got an update from the "grafana" chart repository
...Successfully got an update from the "kube-state-metrics" chart repository
...Successfully got an update from the "harbor" chart repository
...Successfully got an update from the "prometheus-community" chart repository
Update Complete. ⎈Happy Helming!⎈
[root@k8s ~]# helm fetch grafana/grafana --untar
[root@k8s ~]# cd grafana/
[root@k8s grafana]# vim values.yaml
service:
  enabled: true
  type: NodePort
persistence:
  type: pvc
  enabled: true
  storageClassName: default
[root@k8s grafana]# helm install -n prometheus my-grafana .
WARNING: Kubernetes configuration file is group-readable. This is insecure. Location: /root/.kube/config
WARNING: Kubernetes configuration file is world-readable. This is insecure. Location: /root/.kube/config
W0529 03:01:12.006457 3973448 warnings.go:70] policy/v1beta1 PodSecurityPolicy is deprecated in v1.21+, unavailable in v1.25+
W0529 03:01:12.011064 3973448 warnings.go:70] policy/v1beta1 PodSecurityPolicy is deprecated in v1.21+, unavailable in v1.25+
W0529 03:01:12.103402 3973448 warnings.go:70] policy/v1beta1 PodSecurityPolicy is deprecated in v1.21+, unavailable in v1.25+
W0529 03:01:12.103686 3973448 warnings.go:70] policy/v1beta1 PodSecurityPolicy is deprecated in v1.21+, unavailable in v1.25+
NAME: my-grafana
LAST DEPLOYED: Sat May 29 03:01:11 2021
NAMESPACE: prometheus
STATUS: deployed
REVISION: 1
NOTES:
1. Get your 'admin' user password by running:

   kubectl get secret --namespace prometheus my-grafana -o jsonpath="{.data.admin-password}" | base64 --decode ; echo

2. The Grafana server can be accessed via port 80 on the following DNS name from within your cluster:

   my-grafana.prometheus.svc.cluster.local

   Get the Grafana URL to visit by running these commands in the same shell:
export NODE_PORT=$(kubectl get --namespace prometheus -o jsonpath="{.spec.ports[0].nodePort}" services my-grafana)
     export NODE_IP=$(kubectl get nodes --namespace prometheus -o jsonpath="{.items[0].status.addresses[0].address}")
     echo http://$NODE_IP:$NODE_PORT


3. Login with the password from step 1 and the username: admin
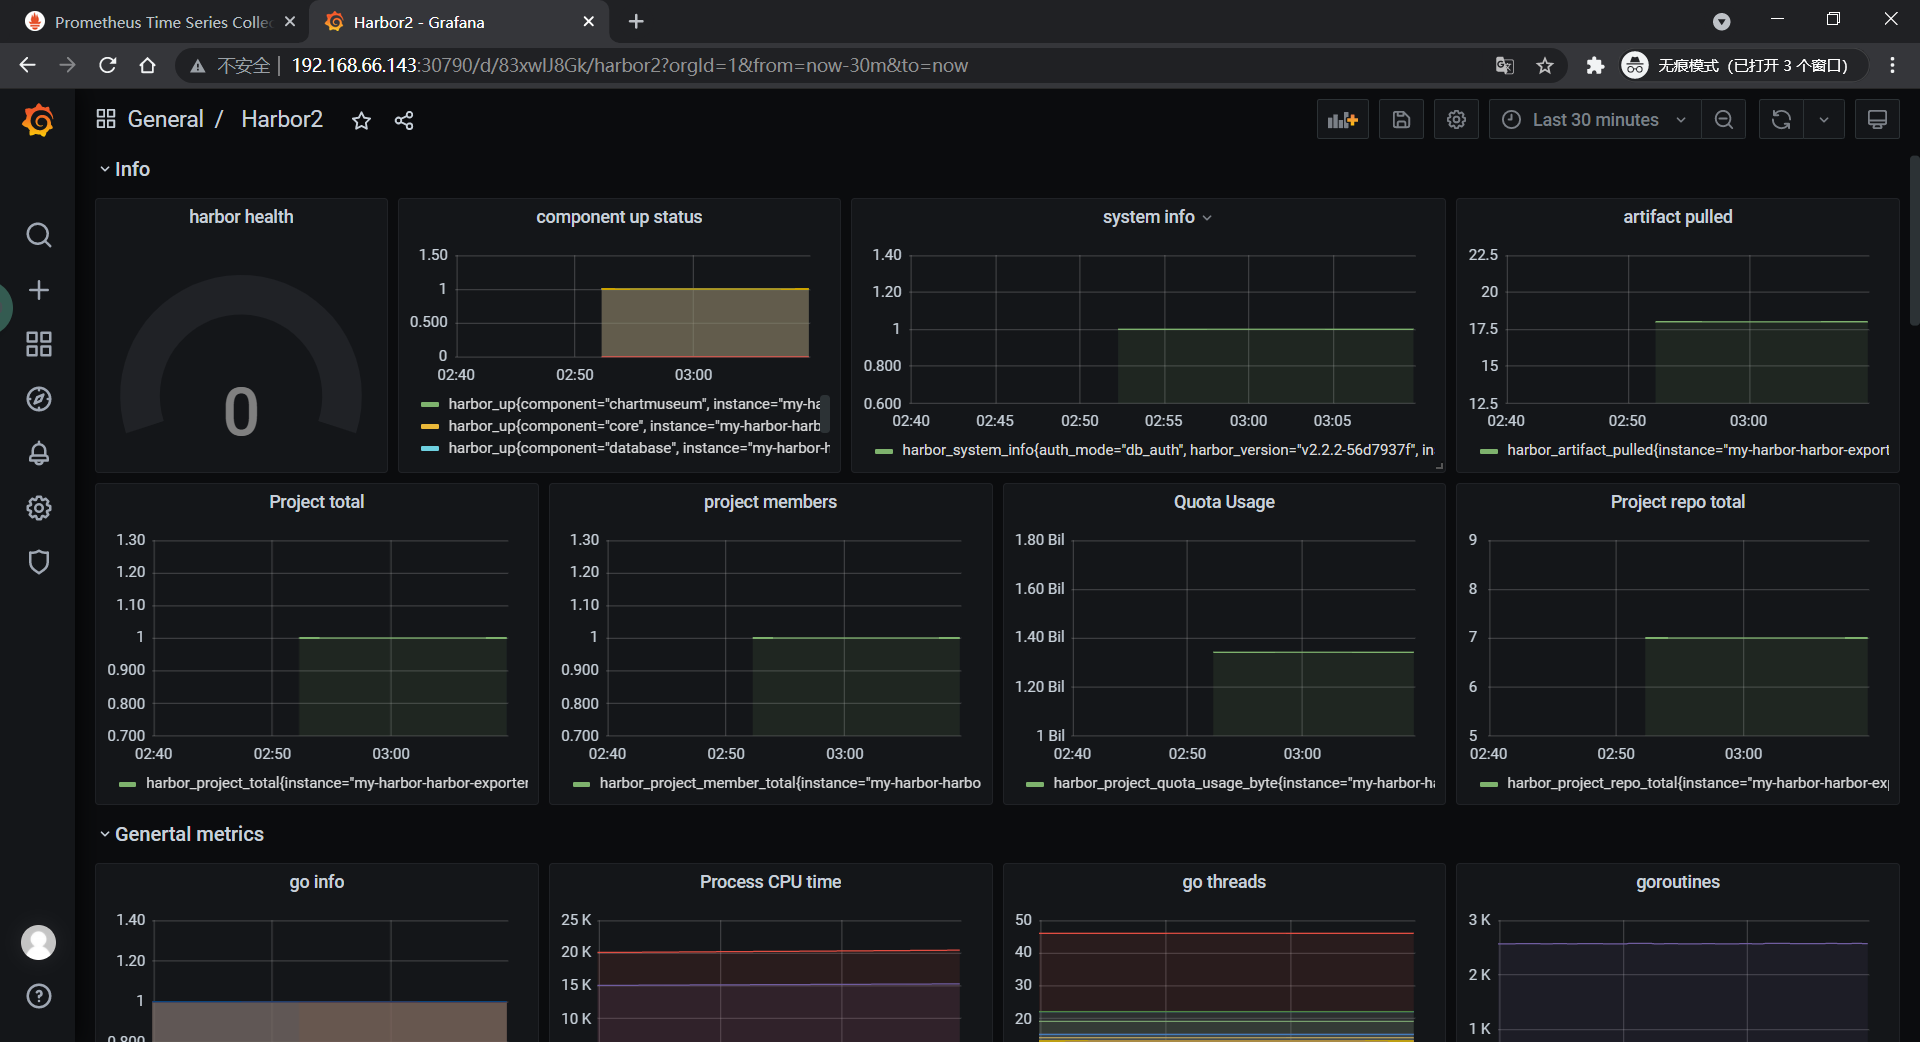
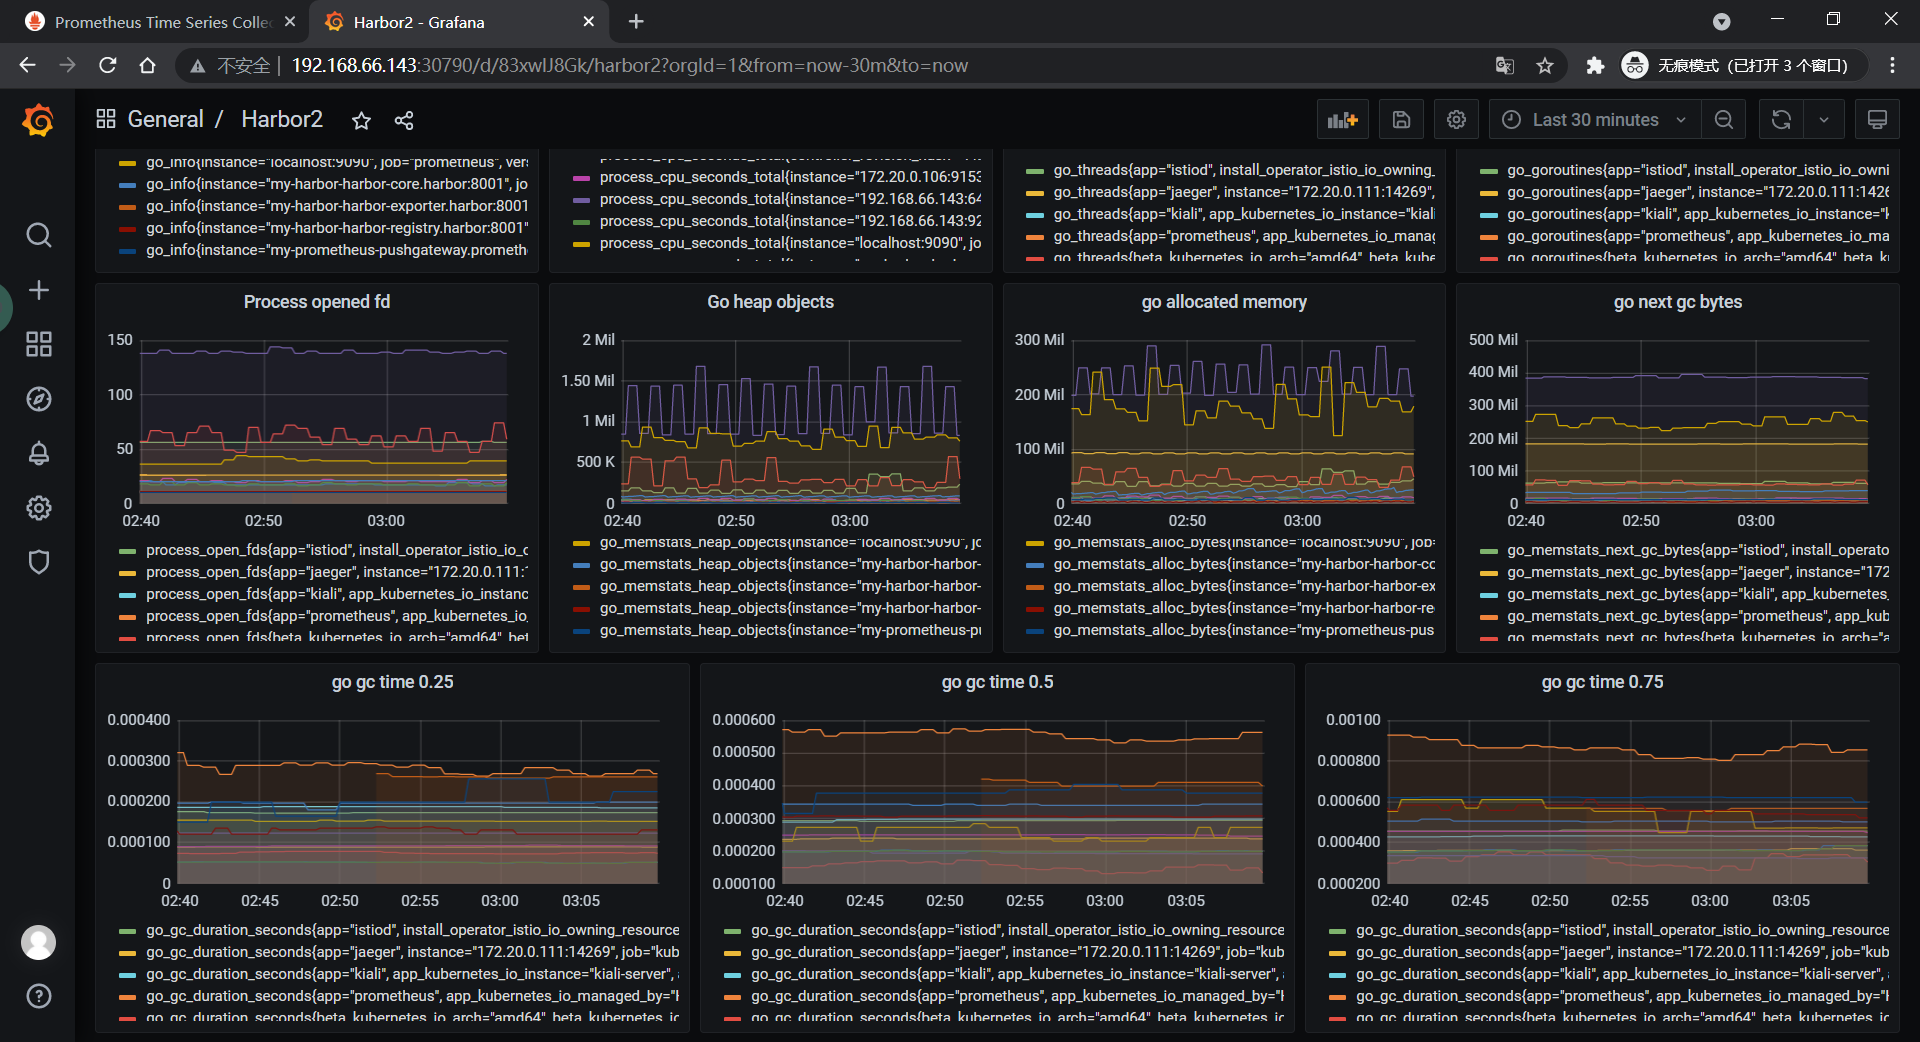
五、导入harbor的dashboard
https://github.com/goharbor/harbor/tree/master/contrib/grafana-dashborad