试用sealyun的一键部署k8s集群脚本
网站:https://sealyun.com/docs/
github项目地址:https://github.com/fanux/sealos
问题:prometheus监控那个没搞好
一直在更新,最新版1.17.0
一、准备环境
| 主机名 | IP地址 | 操作系统 | 配置 |
|---|---|---|---|
| k8s-master1 | 192.168.1.53 | CentOS 7.6.1810 | 4C4G |
| k8s-master2 | 192.168.1.55 | CentOS 7.6.1810 | 4C2G |
| k8s-master3 | 192.168.1.64 | CentOS 7.6.1810 | 4C2G |
| k8s-node1 | 192.168.1.66 | CentOS 7.6.1810 | 4C2G |
| k8s-node2 | 192.168.1.72 | CentOS 7.6.1810 | 4C2G |
服务器密码:123456
时间需要同步
二、高可用安装
在随便一个机器执行下面命令,稳妥起见,最好screen里面进行
# 下载sealos二进制工具
[root@k8s-master2 ~]# wget https://github.com/fanux/sealos/releases/download/v3.0.1/sealos &&     chmod +x sealos && mv sealos /usr/bin

# 安装一个三master的kubernetes集群
[root@k8s-master2 ~]# sealos init --passwd 123456 \
--master 192.168.1.53 --master 192.168.1.55 --master 192.168.1.64 \
--node 192.168.1.66 --node 192.168.1.72 \
--pkg-url https://sealyun.oss-cn-beijing.aliyuncs.com/413bd3624b2fb9e466601594b4f72072-1.17.0/kube1.17.0.tar.gz \
--version v1.17.0
参数含义
| 参数名 | 含义 | 示例 |
|---|---|---|
| passwd | 服务器密码 | 123456 |
| master | k8s master节点IP地址 | 192.168.0.2 |
| node | k8s node节点IP地址 | 192.168.0.3 |
| pkg-url | 离线资源包地址,支持下载到本地,或者一个远程地址 | /root/kube1.16.0.tar.gz |
| version | 资源包对应的版本 | v1.16.0 |
三、安装完成后界面
很快吧,几分钟
四、如何添加master节点
比如当前就一个master节点一个node节点
[root@k8s-master1 ~]# kubectl get nodes
NAME          STATUS   ROLES    AGE   VERSION
k8s-master1   Ready    master   15m   v1.17.0
k8s-node1     Ready    <none>   15m   v1.17.0
参考:https://sealyun.com/docs/aatutorial.html#%E5%A2%9E%E5%8A%A0master%E8%8A%82%E7%82%B9
增加master节点稍微麻烦一点, 如新加一个k8s-master2(ip:192.168.1.55) k8s-master1的IP为192.168.1.53
4.1 安装docker和kubeadm等
直接使用它的脚本初始化算了
# 传输kube目录
[root@k8s-master1 ~]# scp -rp kube 192.168.1.55:/root/
# 执行初始化
[root@k8s-master2 ~]# cd kube/shell/ && sh init.sh
4.2获取 join command
其实第一次初始化会出输出的
[root@k8s-master1 ~]# kubeadm token create --print-join-command
W1213 17:58:01.744590   55580 validation.go:28] Cannot validate kube-proxy config - no validator is available
W1213 17:58:01.744708   55580 validation.go:28] Cannot validate kubelet config - no validator is available
kubeadm join apiserver.cluster.local:6443 --token thwsz3.scm2uk69xth1d5zb     --discovery-token-ca-cert-hash sha256:fdb6386674e05007355de853a0319220d93401c404c330a4e77f022b771f3c63
[root@k8s-master1 ~]# kubeadm init phase upload-certs --upload-certs
W1213 20:28:06.751979   16033 version.go:101] could not fetch a Kubernetes version from the internet: unable to get URL "https://dl.k8s.io/release/stable-1.txt": Get https://dl.k8s.io/release/stable-1.txt: net/http: request canceled while waiting for connection (Client.Timeout exceeded while awaiting headers)
W1213 20:28:06.752138   16033 version.go:102] falling back to the local client version: v1.17.0
W1213 20:28:06.752236   16033 validation.go:28] Cannot validate kube-proxy config - no validator is available
W1213 20:28:06.752240   16033 validation.go:28] Cannot validate kubelet config - no validator is available
[upload-certs] Storing the certificates in Secret "kubeadm-certs" in the "kube-system" Namespace
[upload-certs] Using certificate key:
97be24d0c6699799a065cf8016c143674df0e1f7996de7d6742647d5d7c245d6
4.2 在k8s-master2上操作
[root@k8s-master2 ~]# echo "192.168.1.53 apiserver.cluster.local" >> /etc/hosts
# 加入集群
[root@k8s-master2 ~]# kubeadm join apiserver.cluster.local:6443 --token thwsz3.scm2uk69xth1d5zb     --discovery-token-ca-cert-hash sha256:fdb6386674e05007355de853a0319220d93401c404c330a4e77f022b771f3c63 --control-plane --certificate-key 97be24d0c6699799a065cf8016c143674df0e1f7996de7d6742647d5d7c245d6
输出
[root@k8s-master2 ~]# kubeadm join apiserver.cluster.local:6443 --token thwsz3.scm2uk69xth1d5zb --discovery-token-ca-cert-hash sha256:fdb6386674e05007355de853a0319220d93401c404c330a4e77f022b771f3c63 --control-plane --certificate-key 97be24d0c6699799a065cf8016c143674df0e1f7996de7d6742647d5d7c245d6
This is a control plan
[preflight] Running pre-flight checks
[WARNING IsDockerSystemdCheck]: detected "cgroupfs" as the Docker cgroup driver. The recommended driver is "systemd". Please follow the guide at https://kubernetes.io/docs/setup/cri/
[WARNING FileExisting-socat]: socat not found in system path
[WARNING Hostname]: hostname "k8s-master2" could not be reached
[WARNING Hostname]: hostname "k8s-master2": lookup k8s-master2 on 192.168.1.1:53: no such host
[preflight] Reading configuration from the cluster...
[preflight] FYI: You can look at this config file with 'kubectl -n kube-system get cm kubeadm-config -oyaml'
[preflight] Running pre-flight checks before initializing the new control plane instance
[preflight] Pulling images required for setting up a Kubernetes cluster
[preflight] This might take a minute or two, depending on the speed of your internet connection
[preflight] You can also perform this action in beforehand using 'kubeadm config images pull'
[download-certs] Downloading the certificates in Secret "kubeadm-certs" in the "kube-system" Namespace
[certs] Using certificateDir folder "/etc/kubernetes/pki"
[certs] Generating "etcd/peer" certificate and key
[certs] etcd/peer serving cert is signed for DNS names [k8s-master2 localhost] and IPs [192.168.1.55 127.0.0.1 ::1]
[certs] Generating "etcd/healthcheck-client" certificate and key
[certs] Generating "apiserver-etcd-client" certificate and key
[certs] Generating "etcd/server" certificate and key
[certs] etcd/server serving cert is signed for DNS names [k8s-master2 localhost] and IPs [192.168.1.55 127.0.0.1 ::1]
[certs] Generating "apiserver" certificate and key
[certs] apiserver serving cert is signed for DNS names [k8s-master2 kubernetes kubernetes.default kubernetes.default.svc kubernetes.default.svc.cluster.local apiserver.cluster.local apiserver.cluster.local] and IPs [10.96.0.1 192.168.1.55 127.0.0.1 192.168.1.53 10.103.97.2]
[certs] Generating "apiserver-kubelet-client" certificate and key
[certs] Generating "front-proxy-client" certificate and key
[certs] Valid certificates and keys now exist in "/etc/kubernetes/pki"
[certs] Using the existing "sa" key
[kubeconfig] Generating kubeconfig files
[kubeconfig] Using kubeconfig folder "/etc/kubernetes"
[kubeconfig] Writing "admin.conf" kubeconfig file
[kubeconfig] Writing "controller-manager.conf" kubeconfig file
[kubeconfig] Writing "scheduler.conf" kubeconfig file
[control-plane] Using manifest folder "/etc/kubernetes/manifests"
[control-plane] Creating static Pod manifest for "kube-apiserver"
W1213 20:28:31.418446 25982 manifests.go:214] the default kube-apiserver authorization-mode is "Node,RBAC"; using "Node,RBAC"
[control-plane] Creating static Pod manifest for "kube-controller-manager"
W1213 20:28:31.424027 25982 manifests.go:214] the default kube-apiserver authorization-mode is "Node,RBAC"; using "Node,RBAC"
[control-plane] Creating static Pod manifest for "kube-scheduler"
W1213 20:28:31.424770 25982 manifests.go:214] the default kube-apiserver authorization-mode is "Node,RBAC"; using "Node,RBAC"
[check-etcd] Checking that the etcd cluster is healthy
[kubelet-start] Downloading configuration for the kubelet from the "kubelet-config-1.17" ConfigMap in the kube-system namespace
[kubelet-start] Writing kubelet configuration to file "/var/lib/kubelet/config.yaml"
[kubelet-start] Writing kubelet environment file with flags to file "/var/lib/kubelet/kubeadm-flags.env"
[kubelet-start] Starting the kubelet
[kubelet-start] Waiting for the kubelet to perform the TLS Bootstrap...
[etcd] Announced new etcd member joining to the existing etcd cluster
[etcd] Creating static Pod manifest for "etcd"
[etcd] Waiting for the new etcd member to join the cluster. This can take up to 40s
{"level":"warn","ts":"2019-12-13T20:28:49.455+0800","caller":"clientv3/retry_interceptor.go:61","msg":"retrying of unary invoker failed","target":"passthrough:///https://192.168.1.55:2379","attempt":0,"error":"rpc error: code = DeadlineExceeded desc = context deadline exceeded"}
[upload-config] Storing the configuration used in ConfigMap "kubeadm-config" in the "kube-system" Namespace
[mark-control-plane] Marking the node k8s-master2 as control-plane by adding the label "node-role.kubernetes.io/master=''"
[mark-control-plane] Marking the node k8s-master2 as control-plane by adding the taints [node-role.kubernetes.io/master:NoSchedule]
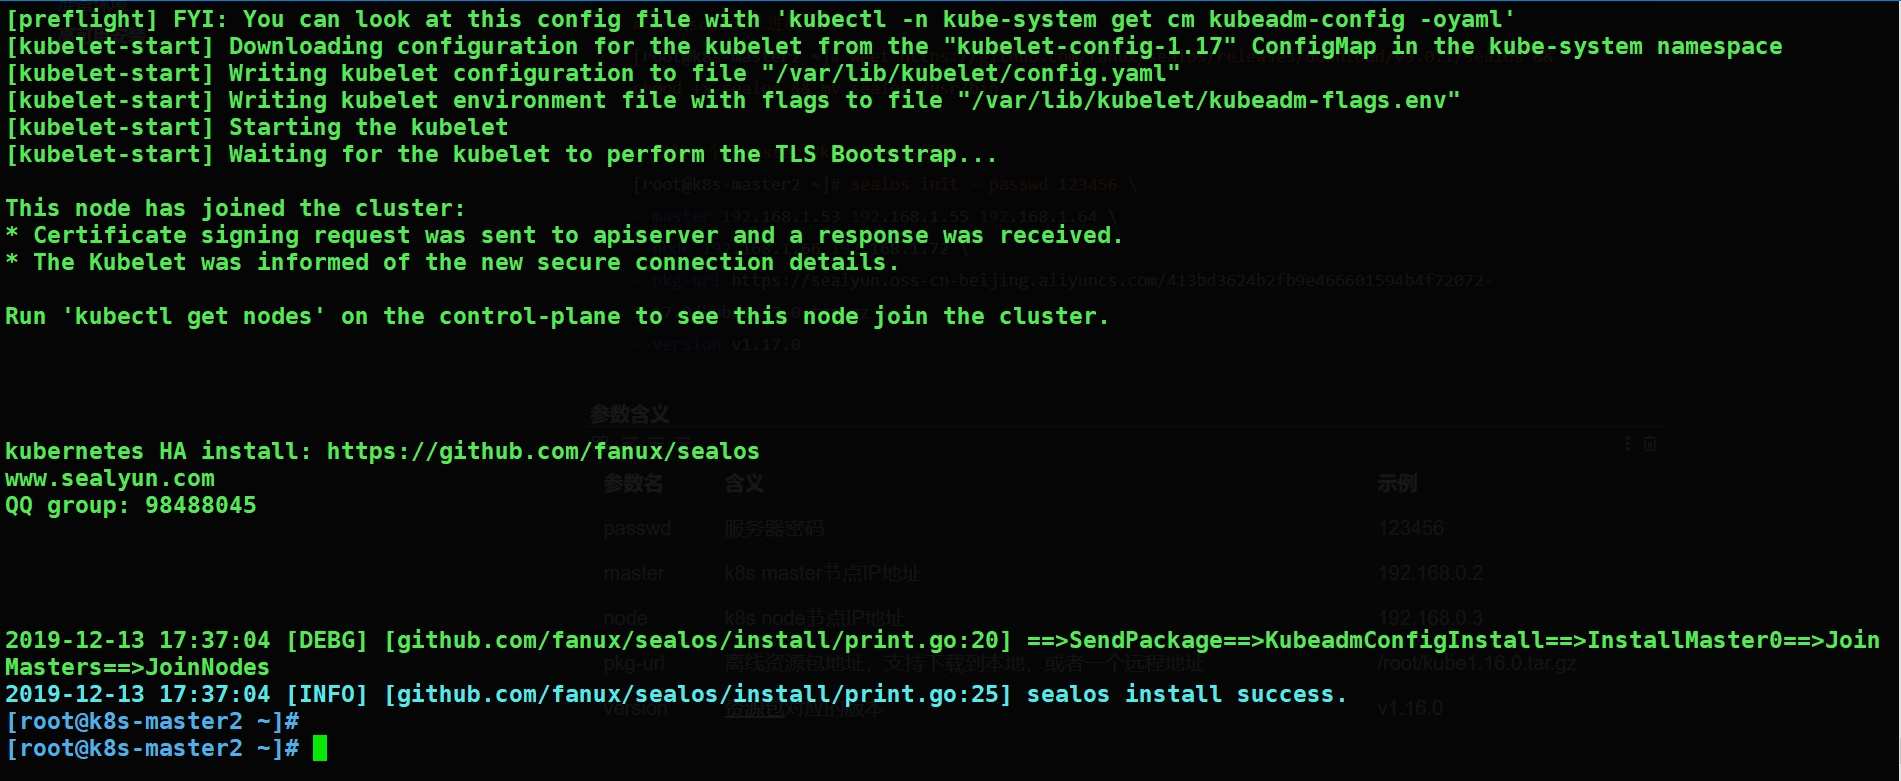
This node has joined the cluster and a new control plane instance was created:
* Certificate signing request was sent to apiserver and approval was received.
* The Kubelet was informed of the new secure connection details.
* Control plane (master) label and taint were applied to the new node.
* The Kubernetes control plane instances scaled up.
* A new etcd member was added to the local/stacked etcd cluster.
To start administering your cluster from this node, you need to run the following as a regular user:
mkdir -p $HOME/.kube
sudo cp -i /etc/kubernetes/admin.conf $HOME/.kube/config
sudo chown $(id -u):$(id -g) $HOME/.kube/config
Run 'kubectl get nodes' to see this node join the cluster.
#复制kubeconfig文件
[root@k8s-master2 ~]# mkdir -p $HOME/.kube
[root@k8s-master2 ~]# sudo cp -i /etc/kubernetes/admin.conf $HOME/.kube/config
[root@k8s-master2 ~]# sudo chown $(id -u):$(id -g) $HOME/.kube/config
# 看node节点状态
[root@k8s-master2 ~]# kubectl get nodes
NAME          STATUS   ROLES    AGE    VERSION
k8s-master1   Ready    master   173m   v1.17.0
k8s-master2   Ready    master   105s   v1.17.0
k8s-node1     Ready    <none>   173m   v1.17.0
# 修改hosts文件的apiserver.cluster.local为本机IP,通过看文档(https://sealyun.com/docs/theory.html#%E6%89%A7%E8%A1%8C%E6%B5%81%E7%A8%8B),发现kubectl连的是域名,域名随便解析到哪个master都行,因此应该解析在本机的IP,我连我本机的api server
[root@k8s-master2 ~]# sed 's/192.168.1.53/192.168.1.55/' -i /etc/hosts
4.3 如法炮制,加上master3
# 复制相关文件
[root@k8s-master1 ~]# scp -rp kube 192.168.1.64:
# 初始化master3
[root@k8s-master3 ~]# cd kube/shell/ && sh init.sh
# 添加域名解析,解析到master1或者master2上
[root@k8s-master3 ~]# echo "192.168.1.53 apiserver.cluster.local" >> /etc/hosts
# 加入集群
[root@k8s-master3 ~]# kubeadm join apiserver.cluster.local:6443 \
--token thwsz3.scm2uk69xth1d5zb \
--discovery-token-ca-cert-hash \
sha256:fdb6386674e05007355de853a0319220d93401c404c330a4e77f022b771f3c63 \
--control-plane \
--certificate-key 97be24d0c6699799a065cf8016c143674df0e1f7996de7d6742647d5d7c245d6
# 拷贝kubconfig文件
[root@k8s-master3 ~]# mkdir -p $HOME/.kube
[root@k8s-master3 ~]# sudo cp -i /etc/kubernetes/admin.conf $HOME/.kube/config
[root@k8s-master3 ~]# sudo chown $(id -u):$(id -g) $HOME/.kube/config
#修改hosts的域名解析到本机
[root@k8s-master3 ~]# sed 's/192.168.1.53/192.168.1.64/' -i /etc/hosts
#测试
[root@k8s-master3 ~]# kubectl get nodes
NAME          STATUS   ROLES    AGE     VERSION
k8s-master1   Ready    master   3h18m   v1.17.0
k8s-master2   Ready    master   26m     v1.17.0
k8s-master3   Ready    master   2m21s   v1.17.0
k8s-node1     Ready    <none>   3h18m   v1.17.0
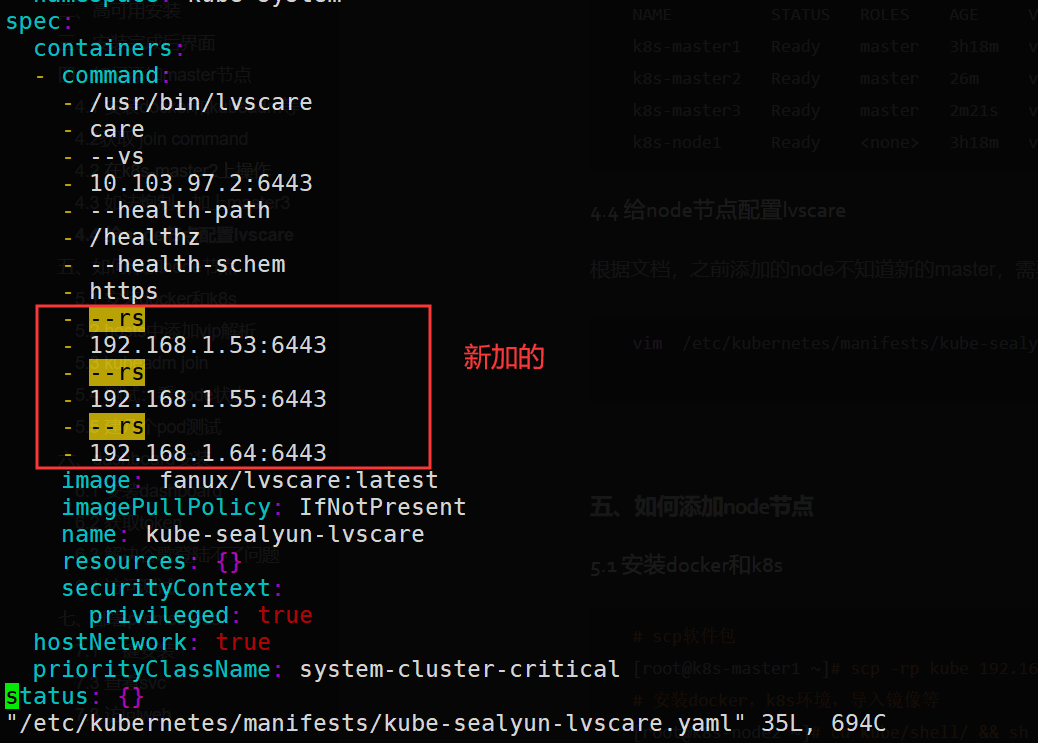
4.4 给node节点配置lvscare
根据文档,之前添加的node不知道新的master,需要改
vim /etc/kubernetes/manifests/kube-sealyun-lvscare-xxx
五、如何添加node节点
5.1 安装docker和k8s
# scp软件包
[root@k8s-master1 ~]# scp -rp kube 192.168.1.72:
# 安装docker,k8s环境,导入镜像等
[root@k8s-node2 ~]# cd kube/shell/ && sh init.sh
5.2 hosts中添加vip解析
# hosts中添加vip解析
[root@k8s-node2 ~]# echo "10.103.97.2 apiserver.cluster.local" >> /etc/hosts   # using vip
5.3 kubeadm join
[root@k8s-node2 ~]# kubeadm join 10.103.97.2:6443 --token thwsz3.scm2uk69xth1d5zb \
    --master 192.168.1.53:6443 \
    --master 192.168.1.55:6443 \
    --master 192.168.1.64:6443 \
    --discovery-token-ca-cert-hash sha256:fdb6386674e05007355de853a0319220d93401c404c330a4e77f022b771f3c63
5.4 测试:看node状态
[root@k8s-master3 ~]# kubectl get nodes -o wide
NAME          STATUS   ROLES    AGE     VERSION   INTERNAL-IP    EXTERNAL-IP   OS-IMAGE                KERNEL-VERSION          CONTAINER-RUNTIME
k8s-master1   Ready    master   3h32m   v1.17.0   192.168.1.53   <none>        CentOS Linux 7 (Core)   3.10.0-957.el7.x86_64   docker://19.3.0
k8s-master2   Ready    master   40m     v1.17.0   192.168.1.55   <none>        CentOS Linux 7 (Core)   3.10.0-957.el7.x86_64   docker://19.3.0
k8s-master3   Ready    master   15m     v1.17.0   192.168.1.64   <none>        CentOS Linux 7 (Core)   3.10.0-957.el7.x86_64   docker://19.3.0
k8s-node1     Ready    <none>   3h31m   v1.17.0   192.168.1.66   <none>        CentOS Linux 7 (Core)   3.10.0-957.el7.x86_64   docker://19.3.0
k8s-node2     Ready    <none>   93s     v1.17.0   192.168.1.72   <none>        CentOS Linux 7 (Core)   3.10.0-957.el7.x86_64   docker://19.3.5
5.5 建几个pod测试
#可以看到,我创建了一个nginx的deployment,有一个pod,运行在k8s-node1上
[root@k8s-master2 ~]# kubectl create deployment nginx  --image=nginx
deployment.apps/nginx created
[root@k8s-master2 ~]# kubectl get pod  -o wide
NAME                     READY   STATUS    RESTARTS   AGE   IP               NODE        NOMINATED NODE   READINESS GATES
nginx-86c57db685-dnjs9   1/1     Running   0          5s    100.111.156.65   k8s-node1   <none>           <none>
# 调整副本数为3,发现有两个在node2上
[root@k8s-master2 ~]# kubectl scale --replicas=3 deployment/nginx
deployment.apps/nginx scaled
[root@k8s-master2 ~]# kubectl get pods -o wide
NAME                     READY   STATUS              RESTARTS   AGE     IP               NODE        NOMINATED NODE   READINESS GATES
nginx-86c57db685-28q6b   0/1     ContainerCreating   0          0s      <none>           k8s-node2   <none>           <none>
nginx-86c57db685-dbrvh   0/1     ContainerCreating   0          0s      <none>           k8s-node2   <none>           <none>
nginx-86c57db685-dnjs9   1/1     Running             0          2m54s   100.111.156.65   k8s-node1   <none>           <none>
# 调整为5个
[root@k8s-master2 ~]# kubectl scale --replicas=5 deployment/nginx
deployment.apps/nginx scaled
[root@k8s-master2 ~]# kubectl get pods -o wide
NAME                     READY   STATUS    RESTARTS   AGE         IP               NODE        NOMINATED NODE   READINESS GATES
nginx-86c57db685-28q6b   1/1     Running   0          2m35s       100.64.169.130   k8s-node2   <none>           <none>
nginx-86c57db685-bshtc   1/1     Running   0          <invalid>   100.111.156.66   k8s-node1   <none>           <none>
nginx-86c57db685-dbrvh   1/1     Running   0          2m35s       100.64.169.129   k8s-node2   <none>           <none>
nginx-86c57db685-dnjs9   1/1     Running   0          5m31s       100.111.156.65   k8s-node1   <none>           <none>
nginx-86c57db685-rj5gw   1/1     Running   0          <invalid>   100.111.156.67   k8s-node1   <none>           <none>
六、dashboard安装
参考:https://sealyun.com/docs/app.html#%E5%AE%89%E8%A3%85app%E5%A6%82dashboard-ingress
6.1 安装dashboard
[root@k8s-master2 ~]# sealos install --pkg-url https://github.com/sealstore/dashboard/releases/download/v2.0.0-bata5/dashboard.tar
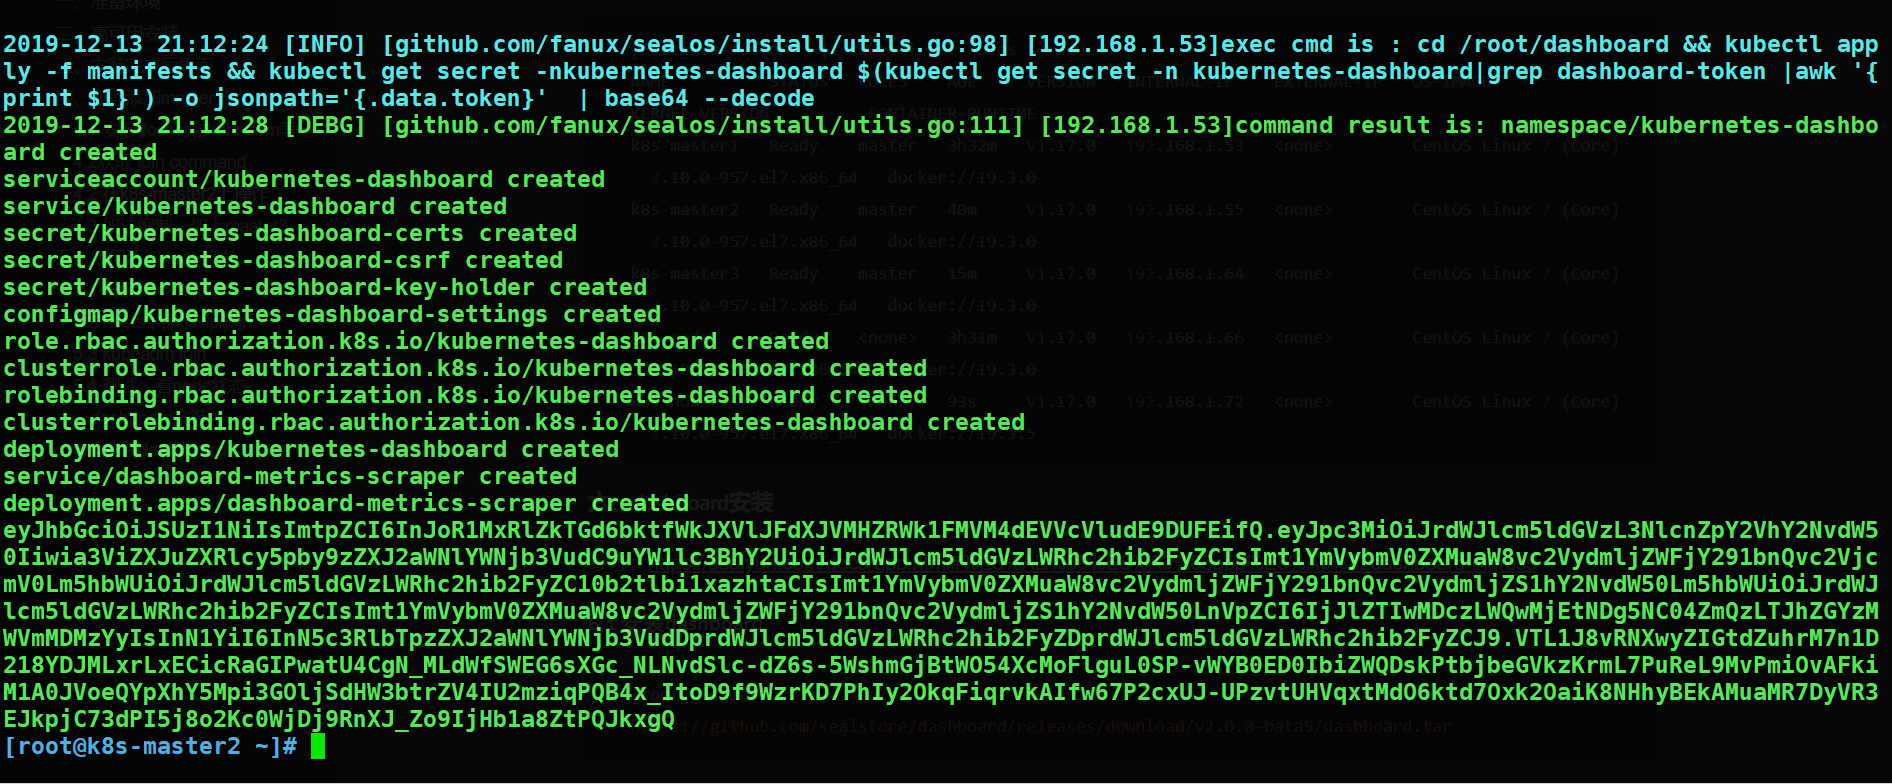
6.2 获取token
[root@k8s-master2 ~]# kubectl get secret -nkubernetes-dashboard     $(kubectl get secret -n kubernetes-dashboard|grep dashboard-token |awk '{print $1}')     -o jsonpath='{.data.token}'  | base64 --decode
eyJhbGciOiJSUzI1NiIsImtpZCI6InJoR1MxRlZkTGd6bktfWkJXVlJFdXJVMHZRWk1FMVM4dEVVcVludE9DUFEifQ.eyJpc3MiOiJrdWJlcm5ldGVzL3NlcnZpY2VhY2NvdW50Iiwia3ViZXJuZXRlcy5pby9zZXJ2aWNlYWNjb3VudC9uYW1lc3BhY2UiOiJrdWJlcm5ldGVzLWRhc2hib2FyZCIsImt1YmVybmV0ZXMuaW8vc2VydmljZWFjY291bnQvc2VjcmV0Lm5hbWUiOiJrdWJlcm5ldGVzLWRhc2hib2FyZC10b2tlbi1xazhtaCIsImt1YmVybmV0ZXMuaW8vc2VydmljZWFjY291bnQvc2VydmljZS1hY2NvdW50Lm5hbWUiOiJrdWJlcm5ldGVzLWRhc2hib2FyZCIsImt1YmVybmV0ZXMuaW8vc2VydmljZWFjY291bnQvc2VydmljZS1hY2NvdW50LnVpZCI6IjJlZTIwMDczLWQwMjEtNDg5NC04ZmQzLTJhZGYzMWVmMDMzYyIsInN1YiI6InN5c3RlbTpzZXJ2aWNlYWNjb3VudDprdWJlcm5ldGVzLWRhc2hib2FyZDprdWJlcm5ldGVzLWRhc2hib2FyZCJ9.VTL1J8vRNXwyZIGtdZuhrM7n1D218YDJMLxrLxECicRaGIPwatU4CgN_MLdWfSWEG6sXGc_NLNvdSlc-dZ6s-5WshmGjBtWO54XcMoFlguL0SP-vWYB0ED0IbiZWQDskPtbjbeGVkzKrmL7PuReL9MvPmiOvAFkiM1A0JVoeQYpXhY5Mpi3GOljSdHW3btrZV4IU2mziqPQB4x_ItoD9f9WzrKD7PhIy2OkqFiqrvkAIfw67P2cxUJ-UPzvtUHVqxtMdO6ktd7Oxk2OaiK8NHhyBEkAMuaMR7DyVR3EJkpjC73dPI5j8o2Kc0WjDj9RnXJ_Zo9IjHb1a8ZtPQJkxgQ
6.3 解决谷歌登陆不了问题
# 删除dashboard
[root@k8s-master2 manifests]# kubectl delete -f dashboard.yaml
# 注释secret部分
[root@k8s-master2 manifests]# sed -n '48,59p' dashboard.yaml
---

#apiVersion: v1
#kind: Secret
#metadata:
#  labels:
#    k8s-app: kubernetes-dashboard
#  name: kubernetes-dashboard-certs
#  namespace: kubernetes-dashboard
#type: Opaque

---
#重建dashboard
[root@k8s-master2 manifests]# kubectl apply -f dashboard.yaml

#创建私钥
[root@k8s-master2 ~]# (umask 077; openssl genrsa -out dashboard.key 2048)

#创建请求文件
[root@k8s-master2 ~]# openssl req -new -key dashboard.key -out dashboard.csr -subj "/O=iLinux/CN=dashboard"
#自签CA
[root@k8s-master2 ~]# openssl x509 -req -in dashboard.csr -CA /etc/kubernetes/pki/ca.crt \
-CAkey /etc/kubernetes/pki/ca.key -CAcreateserial -out dashboard.crt -days 3650

#基于生成的私钥和证书文件创建名为kubernetes-dashboard-certs的Opaque类型的Secret对象,其键名为dashboard.key和dashboard.crt
[root@k8s-master2 ~]# kubectl create secret  generic kubernetes-dashboard-certs -n kubernetes-dashboard --from-file=dashboard.crt=./dashboard.crt --from-file=dashboard.key=./dashboard.key
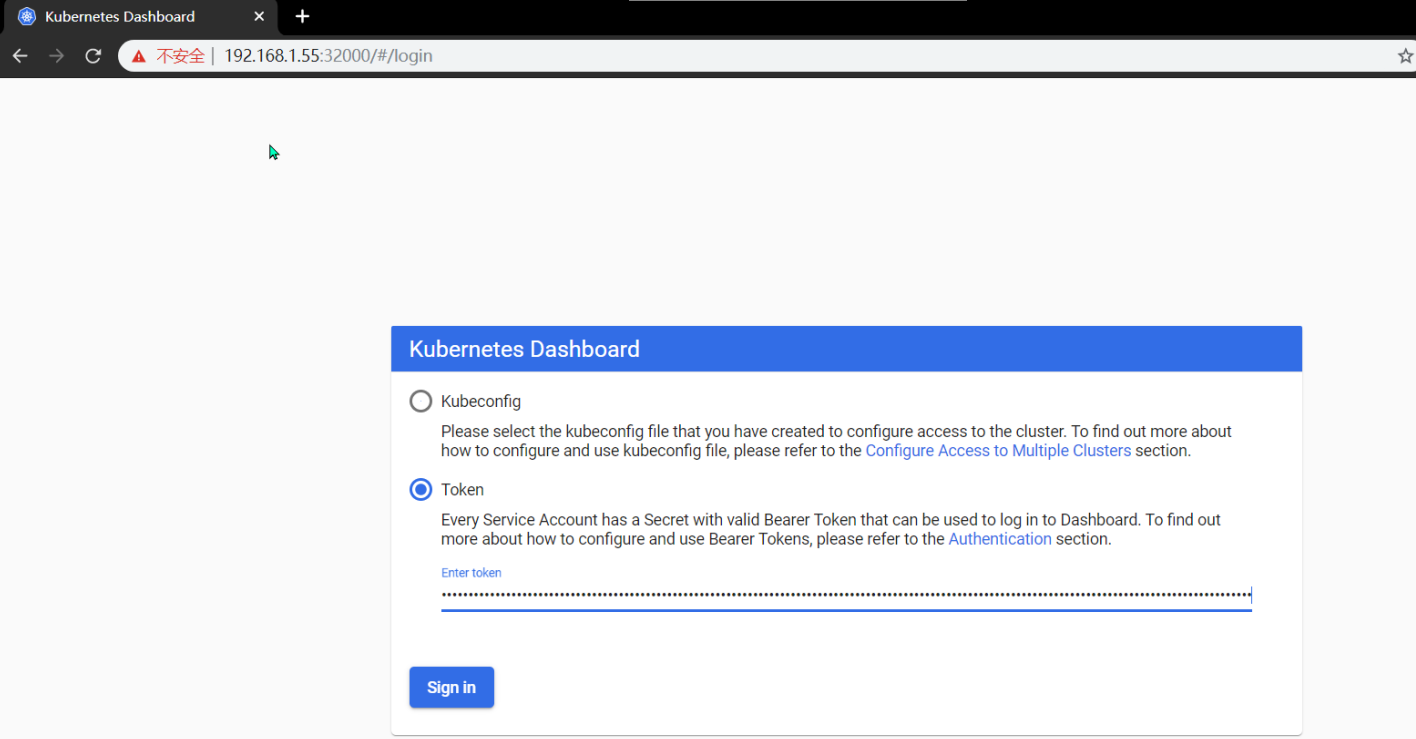
6.4 访问测试
https://192.168.1.55:32000/#/login 节点IP+32000
重新获取token
[root@k8s-master2 ~]# kubectl get secret -nkubernetes-dashboard     $(kubectl get secret -n kubernetes-dashboard|grep dashboard-token |awk '{print $1}')     -o jsonpath='{.data.token}'  | base64 --decode
eyJhbGciOiJSUzI1NiIsImtpZCI6InJoR1MxRlZkTGd6bktfWkJXVlJFdXJVMHZRWk1FMVM4dEVVcVludE9DUFEifQ.eyJpc3MiOiJrdWJlcm5ldGVzL3NlcnZpY2VhY2NvdW50Iiwia3ViZXJuZXRlcy5pby9zZXJ2aWNlYWNjb3VudC9uYW1lc3BhY2UiOiJrdWJlcm5ldGVzLWRhc2hib2FyZCIsImt1YmVybmV0ZXMuaW8vc2VydmljZWFjY291bnQvc2VjcmV0Lm5hbWUiOiJrdWJlcm5ldGVzLWRhc2hib2FyZC10b2tlbi1wYmw3eiIsImt1YmVybmV0ZXMuaW8vc2VydmljZWFjY291bnQvc2VydmljZS1hY2NvdW50Lm5hbWUiOiJrdWJlcm5ldGVzLWRhc2hib2FyZCIsImt1YmVybmV0ZXMuaW8vc2VydmljZWFjY291bnQvc2VydmljZS1hY2NvdW50LnVpZCI6IjkyZjM2ZmIzLTM1NjQtNDI1MS1hMWM5LWQ0NDkzNzZhNTZlNiIsInN1YiI6InN5c3RlbTpzZXJ2aWNlYWNjb3VudDprdWJlcm5ldGVzLWRhc2hib2FyZDprdWJlcm5ldGVzLWRhc2hib2FyZCJ9.fJqbGo2qw6-nQlKrH28wLVzNQ0dEWv7M-P_NjLYo_LmxqVJWY-__wyY0gWq9wPGFNhMPPF6S6K88q9-1vBZzqnX1eyFi3MqjoiXdgeBmd9X-m2v-RBLWnRZYbr3WJ4jiyl9NTKqPDO4B0w0yCYinNKHFi8MiAvLVfRItMpwvN2gCIOv3Df9uCroA38WpEScJ79rgFGId1wo_Z1UcLt3vuKsvPbEcSz63chti9OKO-El56dKDov76DgwmFC3SNHLW37zPWZmzSwp_de0c5MILuayhIPRQHvAMUidkkbFKcAiZFlIYFPmWp8JJqVzqqaBiz39CtZ0DcOmlnkjJfW-VIg
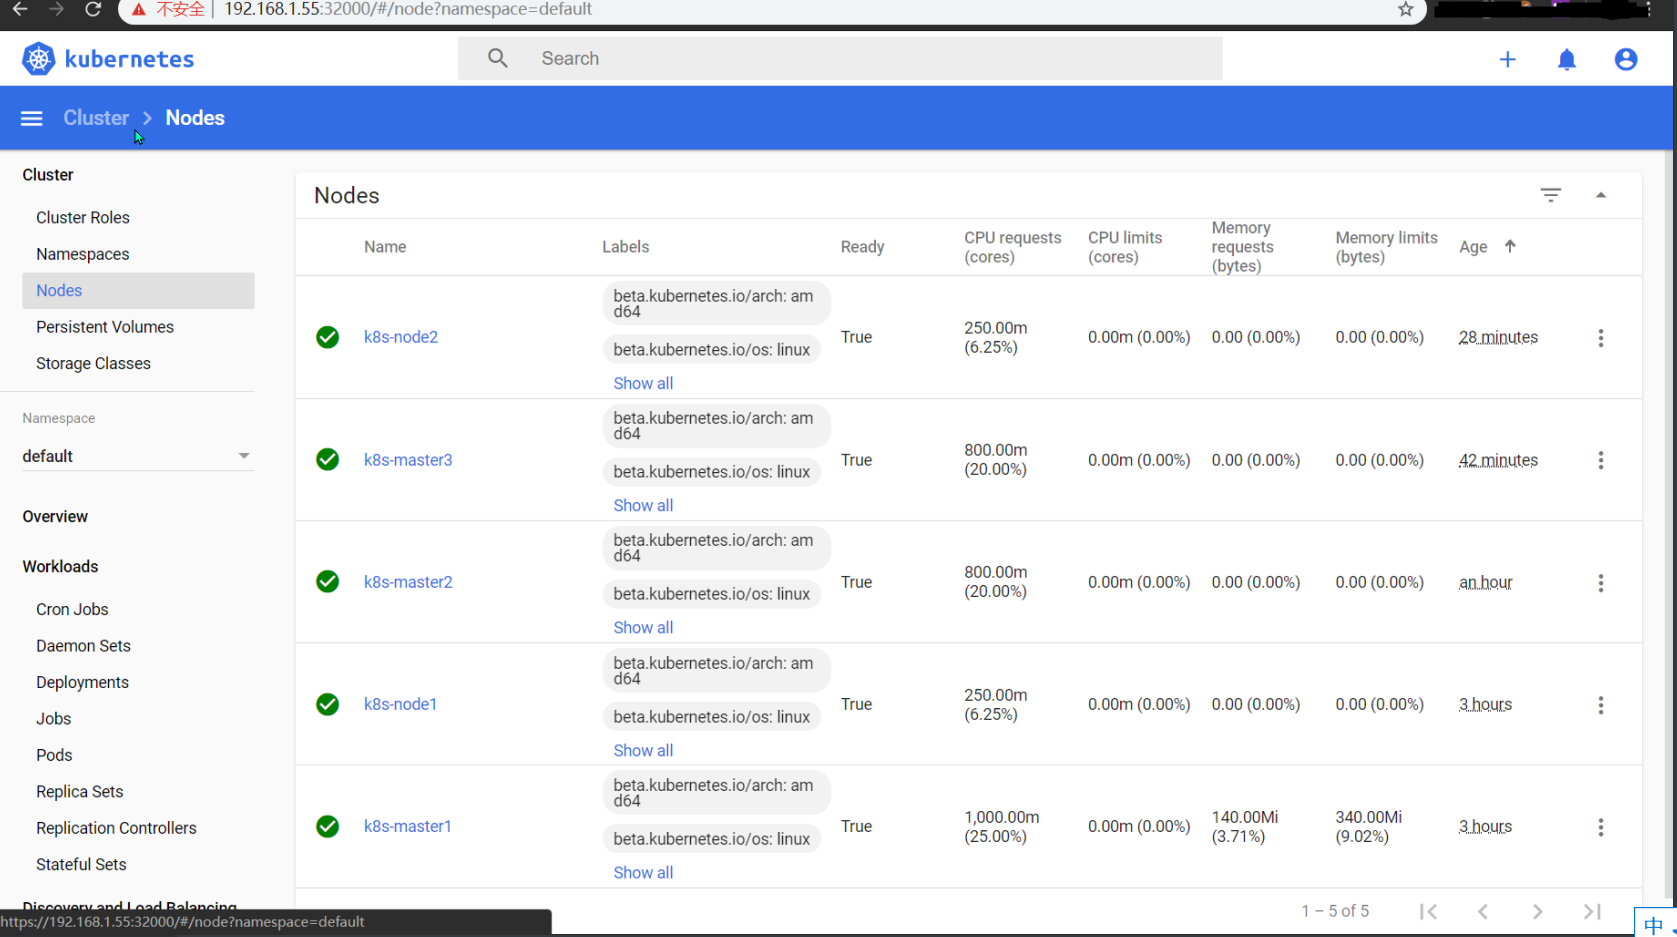
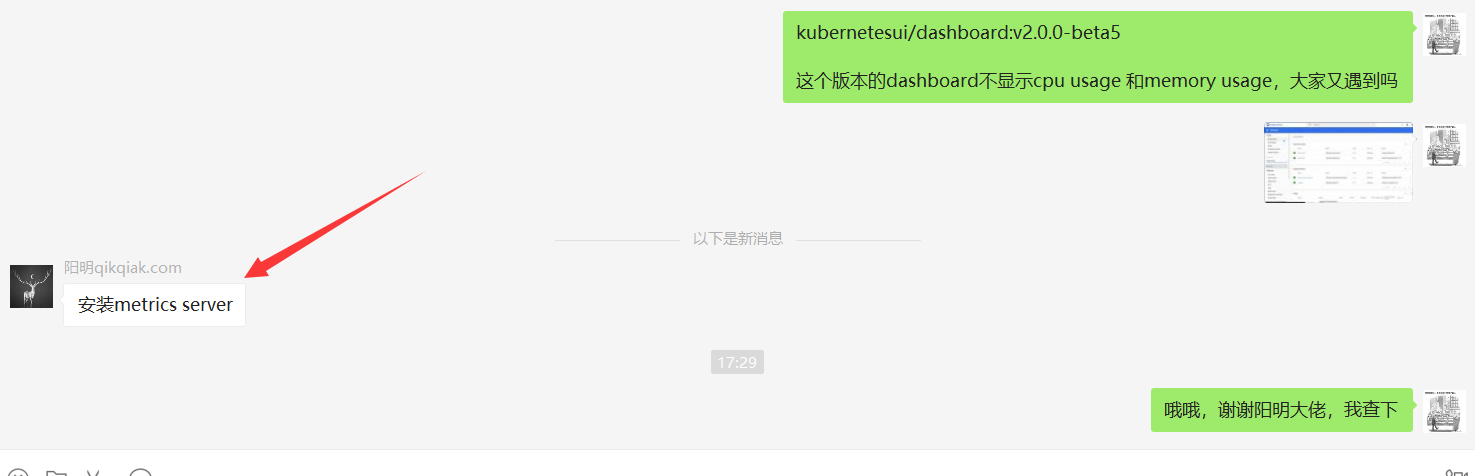
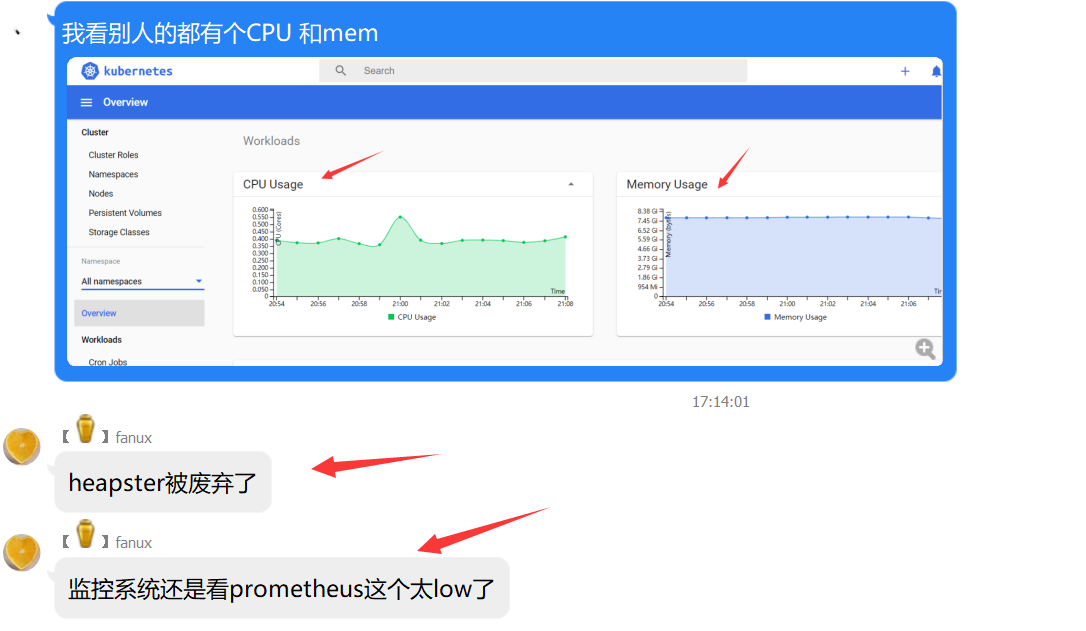
6.5 解决dashboard不显示图表
访问dashboard发现仪表盘不显示CPU usage 和memory usage。
解决: 其实是metrics-server的锅
参考:https://github.com/kubernetes-sigs/metrics-server
参考:https://kubernetes.io/docs/tasks/debug-application-cluster/resource-metrics-pipeline/
参考:https://www.qikqiak.com/post/install-metrics-server/
参考:https://www.cnblogs.com/zisefeizhu/p/11258354.html (metris-server配置)
参考:https://www.cnblogs.com/bluersw/p/11747161.html
参考:阳明大佬,fanux大佬
[root@k8s-master1 ~]# git clone https://github.com/kubernetes-sigs/metrics-server.git
[root@k8s-master1 ~]# cd metrics-server/
[root@k8s-master1 metrics-server]# cd deploy/1.8+/
[root@k8s-master1 1.8+]# ls
aggregated-metrics-reader.yaml  auth-reader.yaml         metrics-server-deployment.yaml  resource-reader.yaml
auth-delegator.yaml             metrics-apiservice.yaml  metrics-server-service.yaml
#修改镜像等
# 这里我遇坑了,刚开始我没加command那部分,总是报`error: metrics not available yet `,kubectl logs看pod日志提示 no metrics known for node,后面看了这篇文章https://www.qikqiak.com/post/install-metrics-server/才知道要改东西,然后--metric-resolution=30s我写成了--metric-resolution 30s容器死活起不起来,kubectl logs看日志才知道不能这么写,要写等号
[root@k8s-master1 1.8+]# cp metrics-server-deployment.yaml{,.bak}
[root@k8s-master1 1.8+]# vim metrics-server-deployment.yaml
[root@k8s-master1 1.8+]# diff metrics-server-deployment.yaml*
32c32
<         image: registry.aliyuncs.com/google_containers/metrics-server-amd64:v0.3.6
---
>         image: k8s.gcr.io/metrics-server-amd64:v0.3.6
36,40d35
<         command:
<         - /metrics-server
<         - --metric-resolution=30s
<         - --kubelet-preferred-address-types=InternalIP,Hostname,InternalDNS,ExternalDNS,ExternalIP
<         - --kubelet-insecure-tls
#部署
[root@k8s-master1 1.8+]# kubectl apply -f .
clusterrole.rbac.authorization.k8s.io/system:aggregated-metrics-reader configured
clusterrolebinding.rbac.authorization.k8s.io/metrics-server:system:auth-delegator created
rolebinding.rbac.authorization.k8s.io/metrics-server-auth-reader created
apiservice.apiregistration.k8s.io/v1beta1.metrics.k8s.io configured
serviceaccount/metrics-server created
deployment.apps/metrics-server created
service/metrics-server created
clusterrole.rbac.authorization.k8s.io/system:metrics-server created
clusterrolebinding.rbac.authorization.k8s.io/system:metrics-server created
--metric-resolution=30s:从 kubelet 采集数据的周期;
--kubelet-preferred-address-types:优先使用 InternalIP 来访问 kubelet,这样可以避免节点名称没有 DNS 解析记录时,通过节点名称调用节点 kubelet API 失败的情况(未配置时默认的情况);
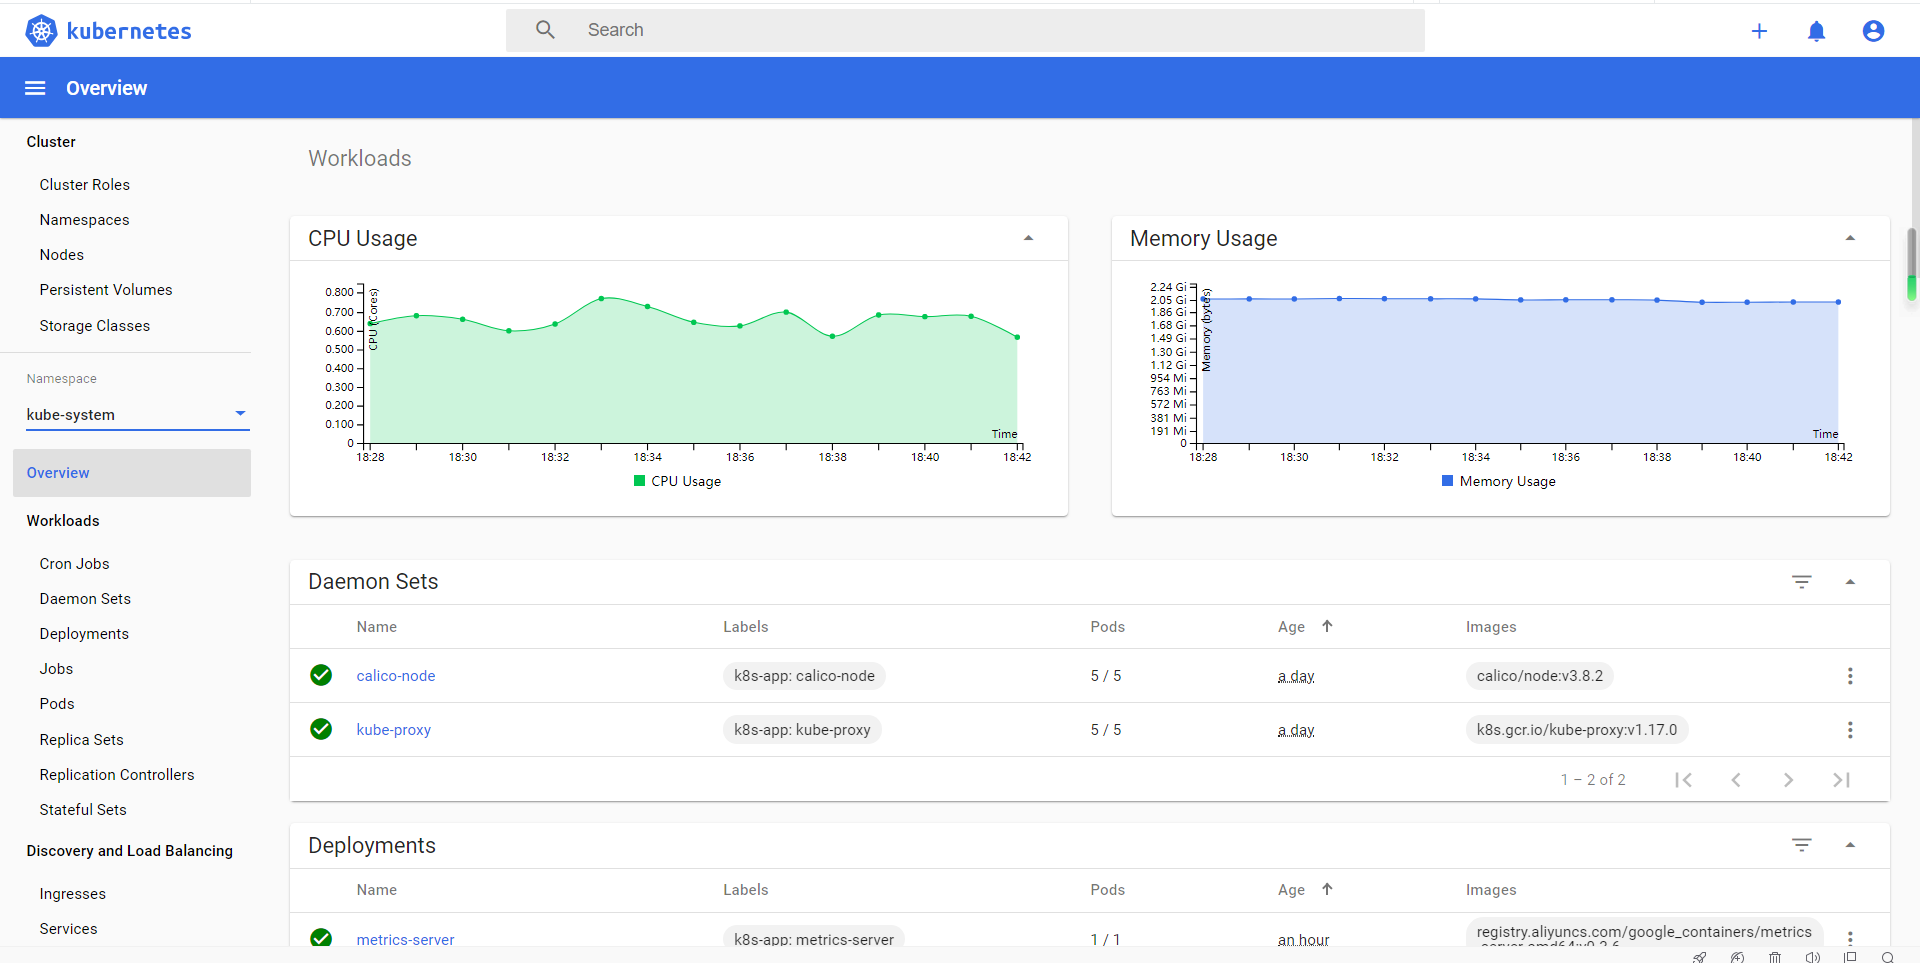
查看运行情况
[root@k8s-master1 1.8+]# kubectl get svc -n kube-system metrics-server
NAME             TYPE        CLUSTER-IP   EXTERNAL-IP   PORT(S)   AGE
metrics-server   ClusterIP   10.96.96.5   <none>        443/TCP   2m30s
[root@k8s-master1 1.8+]#  kubectl -n kube-system get pods -l k8s-app=metrics-server -o wide
NAME                              READY   STATUS    RESTARTS   AGE     IP               NODE        NOMINATED NODE   READINESS GATES
metrics-server-78fbb969f5-n58vk   1/1     Running   0          2m54s   100.111.156.77   k8s-node1   <none>           <none>
metrics-server 的命令行参数 (在任意一个 node 节点上执行下面命令)
$ docker run -it --rm registry.aliyuncs.com/google_containers/metrics-server-amd64:v0.3.6 --help
测试是否成功
[root@k8s-master2 tmp]# kubectl top node
error: metrics not available yet     #说明还未成功,还要等一会儿
[root@k8s-master2 tmp]# kubectl top node
NAME          CPU(cores)   CPU%   MEMORY(bytes)   MEMORY%
k8s-master1   266m         6%     1841Mi          50%
k8s-master2   388m         9%     1136Mi          66%
k8s-master3   353m         8%     1054Mi          61%
k8s-node1     119m         2%     625Mi           36%
k8s-node2     169m         4%     864Mi           50%
浏览器访问:
[root@k8s-master3 ~]# kubectl cluster-info
Kubernetes master is running at https://apiserver.cluster.local:6443
KubeDNS is running at https://apiserver.cluster.local:6443/api/v1/namespaces/kube-system/services/kube-dns:dns/proxy
Metrics-server is running at https://apiserver.cluster.local:6443/api/v1/namespaces/kube-system/services/https:metrics-server:/proxy

To further debug and diagnose cluster problems, use 'kubectl cluster-info dump'.
[root@k8s-master3 ~]# kubectl get apiservice | grep metrics
v1beta1.metrics.k8s.io                 kube-system/metrics-server   True        62m
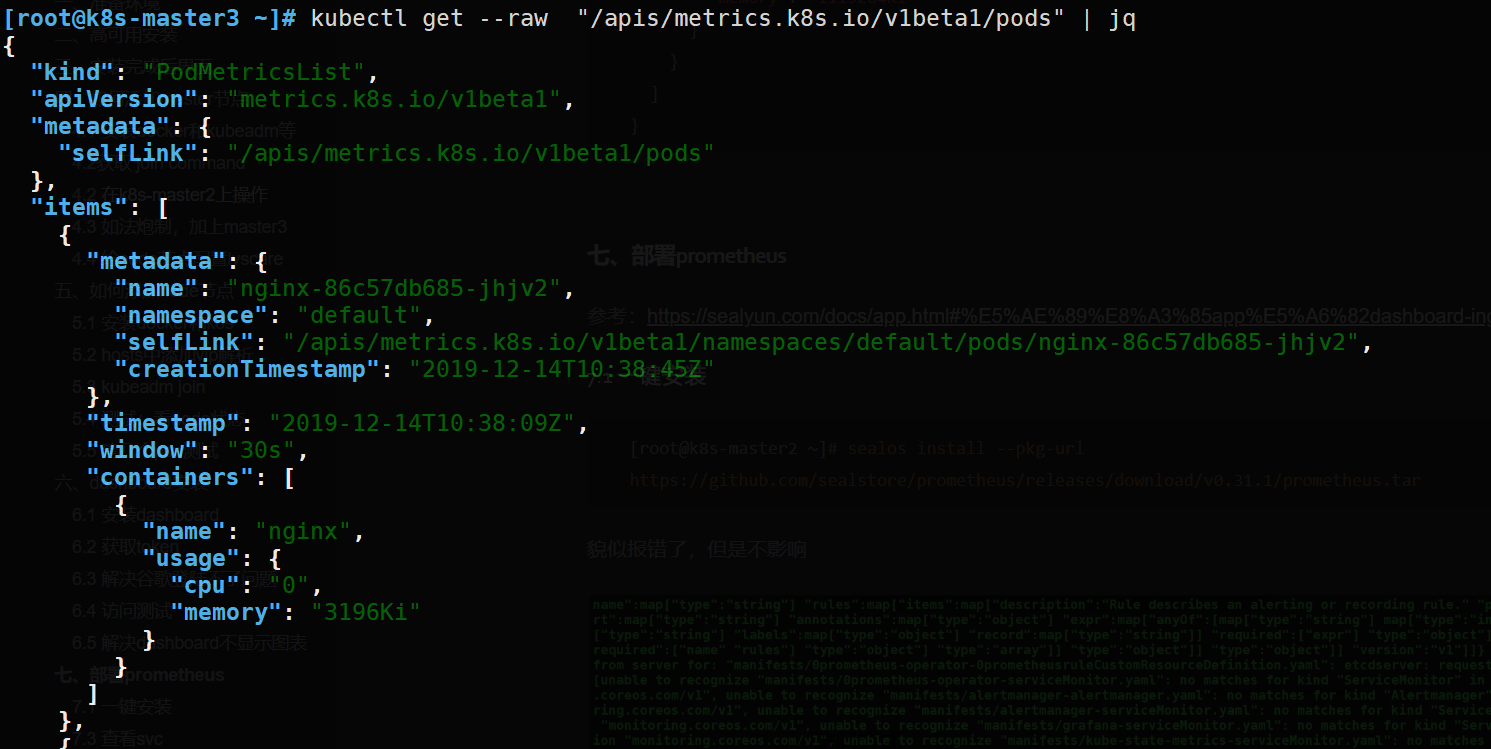
[root@k8s-master3 ~]# kubectl get --raw  "/apis/metrics.k8s.io/v1beta1/nodes" | jq
{
  "kind": "NodeMetricsList",
  "apiVersion": "metrics.k8s.io/v1beta1",
  "metadata": {
    "selfLink": "/apis/metrics.k8s.io/v1beta1/nodes"
  },
  "items": [
    {
      "metadata": {
        "name": "k8s-node1",
        "selfLink": "/apis/metrics.k8s.io/v1beta1/nodes/k8s-node1",
        "creationTimestamp": "2019-12-14T10:38:01Z"
      },
      "timestamp": "2019-12-14T10:37:48Z",
      "window": "30s",
      "usage": {
        "cpu": "107552766n",
        "memory": "640296Ki"
      }
    },
    {
      "metadata": {
        "name": "k8s-node2",
        "selfLink": "/apis/metrics.k8s.io/v1beta1/nodes/k8s-node2",
        "creationTimestamp": "2019-12-14T10:38:01Z"
      },
      "timestamp": "2019-12-14T10:37:56Z",
      "window": "30s",
      "usage": {
        "cpu": "109066035n",
        "memory": "884488Ki"
      }
    },
    {
      "metadata": {
        "name": "k8s-master1",
        "selfLink": "/apis/metrics.k8s.io/v1beta1/nodes/k8s-master1",
        "creationTimestamp": "2019-12-14T10:38:01Z"
      },
      "timestamp": "2019-12-14T10:37:47Z",
      "window": "30s",
      "usage": {
        "cpu": "233685654n",
        "memory": "1829692Ki"
      }
    },
    {
      "metadata": {
        "name": "k8s-master2",
        "selfLink": "/apis/metrics.k8s.io/v1beta1/nodes/k8s-master2",
        "creationTimestamp": "2019-12-14T10:38:01Z"
      },
      "timestamp": "2019-12-14T10:37:50Z",
      "window": "30s",
      "usage": {
        "cpu": "264923102n",
        "memory": "1157364Ki"
      }
    },
    {
      "metadata": {
        "name": "k8s-master3",
        "selfLink": "/apis/metrics.k8s.io/v1beta1/nodes/k8s-master3",
        "creationTimestamp": "2019-12-14T10:38:01Z"
      },
      "timestamp": "2019-12-14T10:37:50Z",
      "window": "30s",
      "usage": {
        "cpu": "311117663n",
        "memory": "1119204Ki"
      }
    }
  ]
}
七、部署prometheus
参考:https://sealyun.com/docs/app.html#%E5%AE%89%E8%A3%85app%E5%A6%82dashboard-ingress
7.1 一键安装
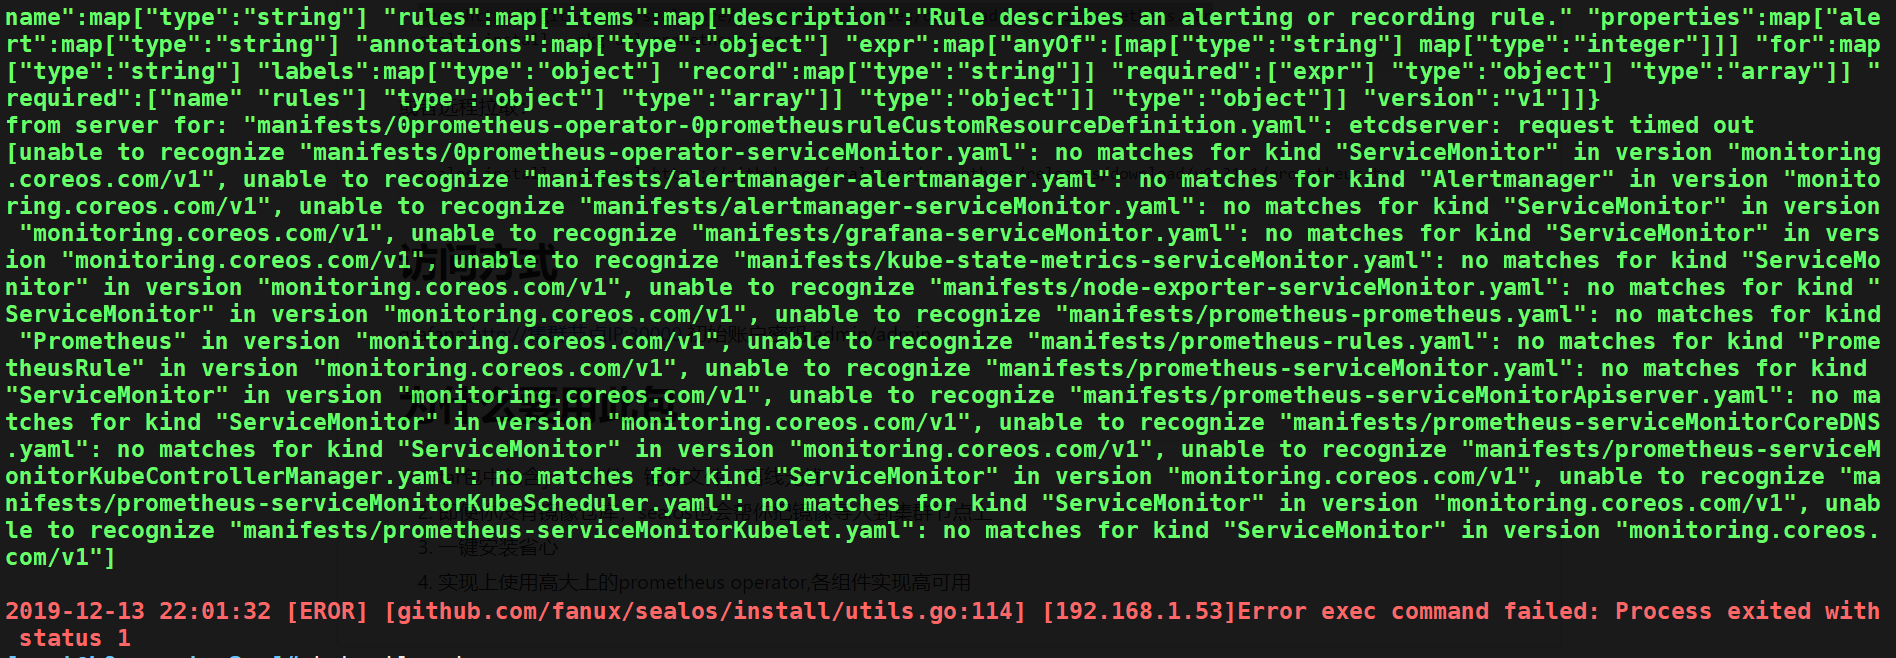
[root@k8s-master2 ~]# sealos install --pkg-url https://github.com/sealstore/prometheus/releases/download/v0.31.1/prometheus.tar
貌似报错了,但是不影响
7.3 查看svc
[root@k8s-master1 ~]# kubectl get ns
NAME                   STATUS   AGE
default                Active   19h
kube-node-lease        Active   19h
kube-public            Active   19h
kube-system            Active   19h
kubernetes-dashboard   Active   15h
monitoring             Active   14h
[root@k8s-master1 ~]# kubectl get svc -n monitoring
NAME                  TYPE        CLUSTER-IP      EXTERNAL-IP   PORT(S)             AGE
alertmanager-main     ClusterIP   10.96.167.122   <none>        9093/TCP            14h
grafana               NodePort    10.96.248.177   <none>        3000:30000/TCP      14h
kube-state-metrics    ClusterIP   None            <none>        8443/TCP,9443/TCP   14h
node-exporter         ClusterIP   None            <none>        9100/TCP            14h
prometheus-adapter    ClusterIP   10.96.160.208   <none>        443/TCP             14h
prometheus-k8s        ClusterIP   10.96.156.6     <none>        9090/TCP            14h
prometheus-operator   ClusterIP   None            <none>        8080/TCP            14h
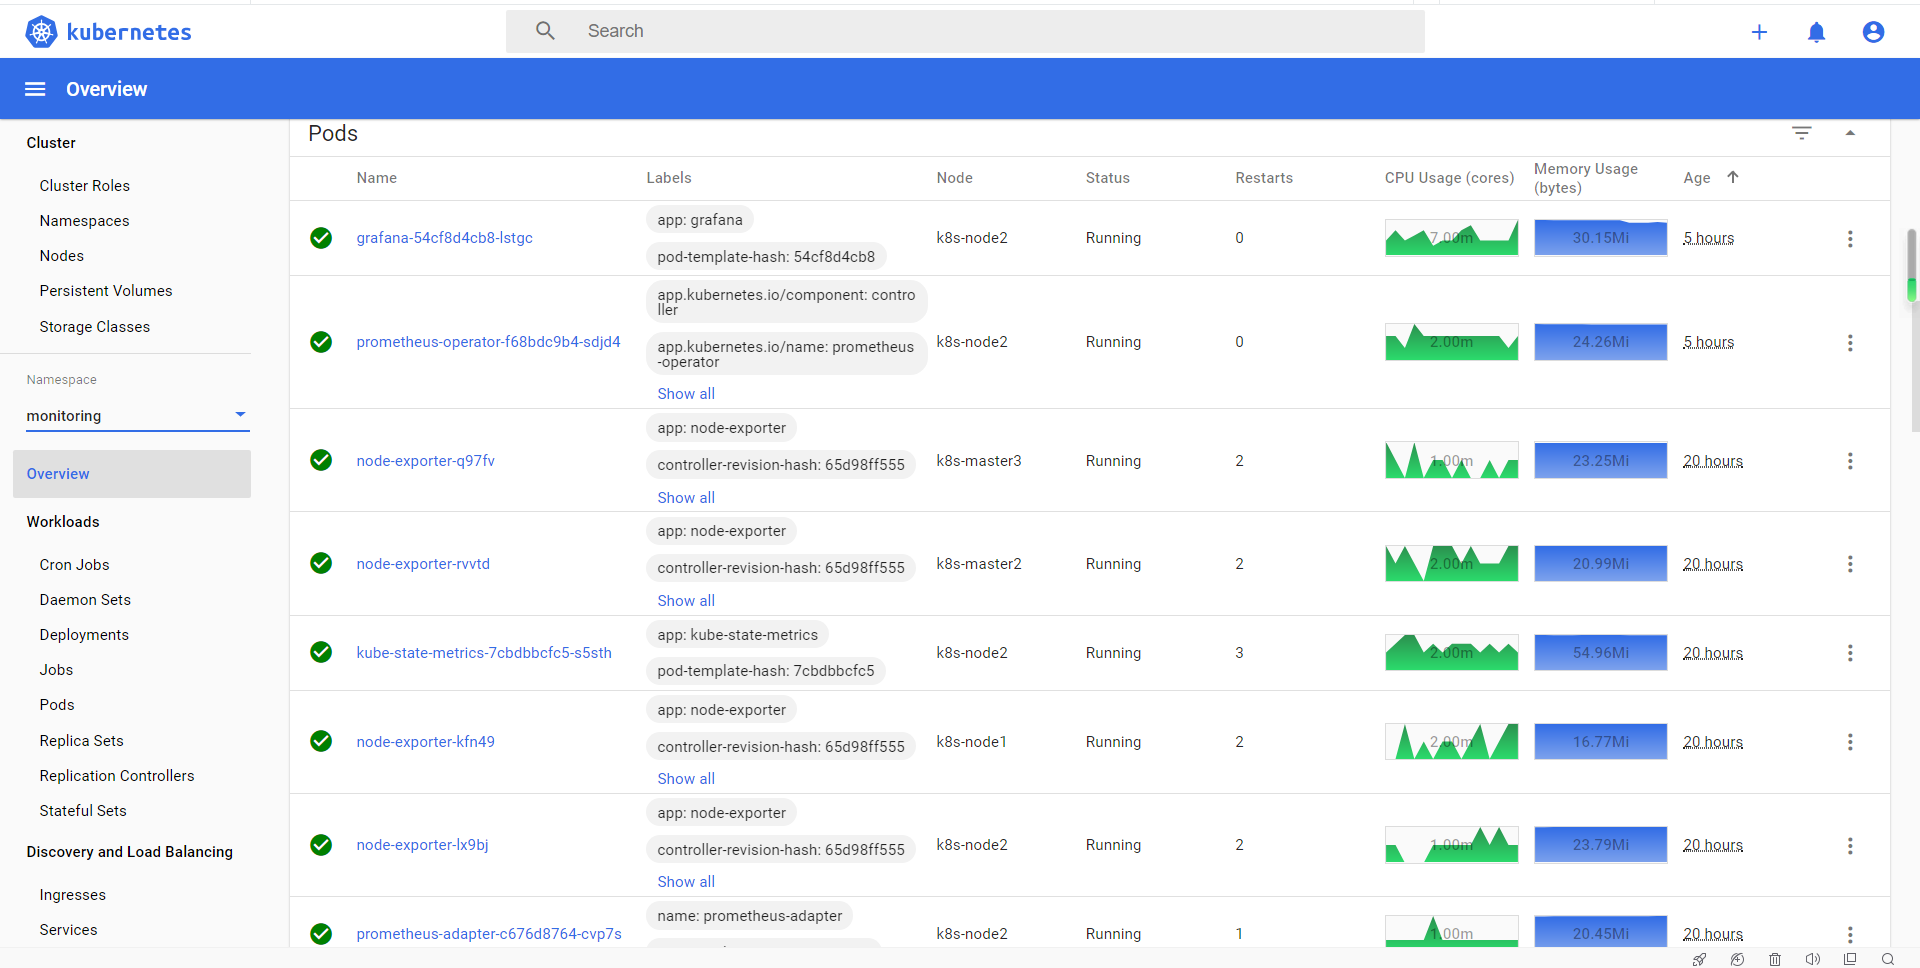
[root@k8s-master1 ~]# kubectl get pod -n monitoring
NAME                                  READY   STATUS         RESTARTS   AGE
grafana-54cf8d4cb8-mlmp8              1/1     Running        1          14h
kube-state-metrics-7cbdbbcfc5-s5sth   3/4     ErrImagePull   3          14h
node-exporter-9ncz9                   2/2     Running        0          14h
node-exporter-kfn49                   2/2     Running        2          14h
node-exporter-lx9bj                   2/2     Running        2          14h
node-exporter-q97fv                   2/2     Running        0          14h
node-exporter-rvvtd                   2/2     Running        0          14h
prometheus-adapter-c676d8764-cvp7s    1/1     Running        1          14h
prometheus-operator-f68bdc9b4-tkxdf   1/1     Running        1          14h
使用kubectl describe看一下
[root@k8s-master1 ~]# kubectl describe pod/kube-state-metrics-7cbdbbcfc5-s5sth -n monitoring
  Warning  Failed          14h (x3 over 14h)      kubelet, k8s-node2  Failed to pull image "k8s.gcr.io/addon-resizer:1.8.4": rpc error: code = Unknown desc = Error response from daemon: Get https://k8s.gcr.io/v2/: net/http: request canceled while waiting for connection (Client.Timeout exceeded while awaiting headers)
# 导入下镜像即可
[root@k8s-node1 ~]# docker save k8s.gcr.io/addon-resizer > addon.tar
[root@k8s-node1 ~]# scp addon.tar 192.168.1.72:
[root@k8s-node2 ~]# docker load < addon.tar
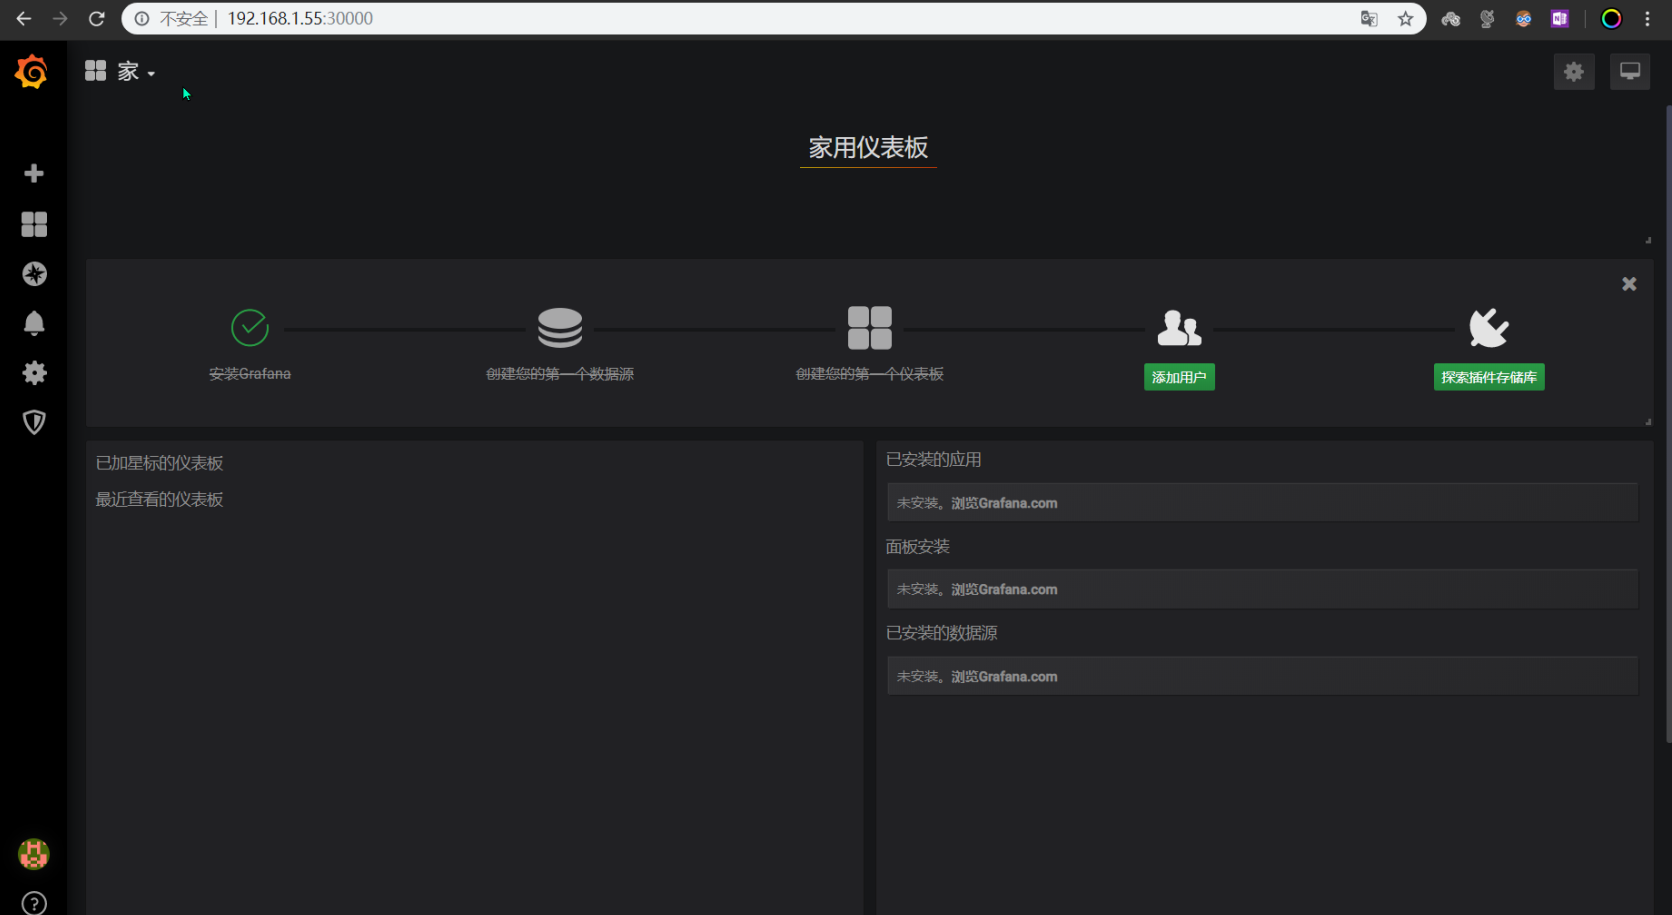
7.3 访问web
http+节点IP+30000端口 用户名admin 密码admin
这里数据库那个一直连不上,暂时不搞了
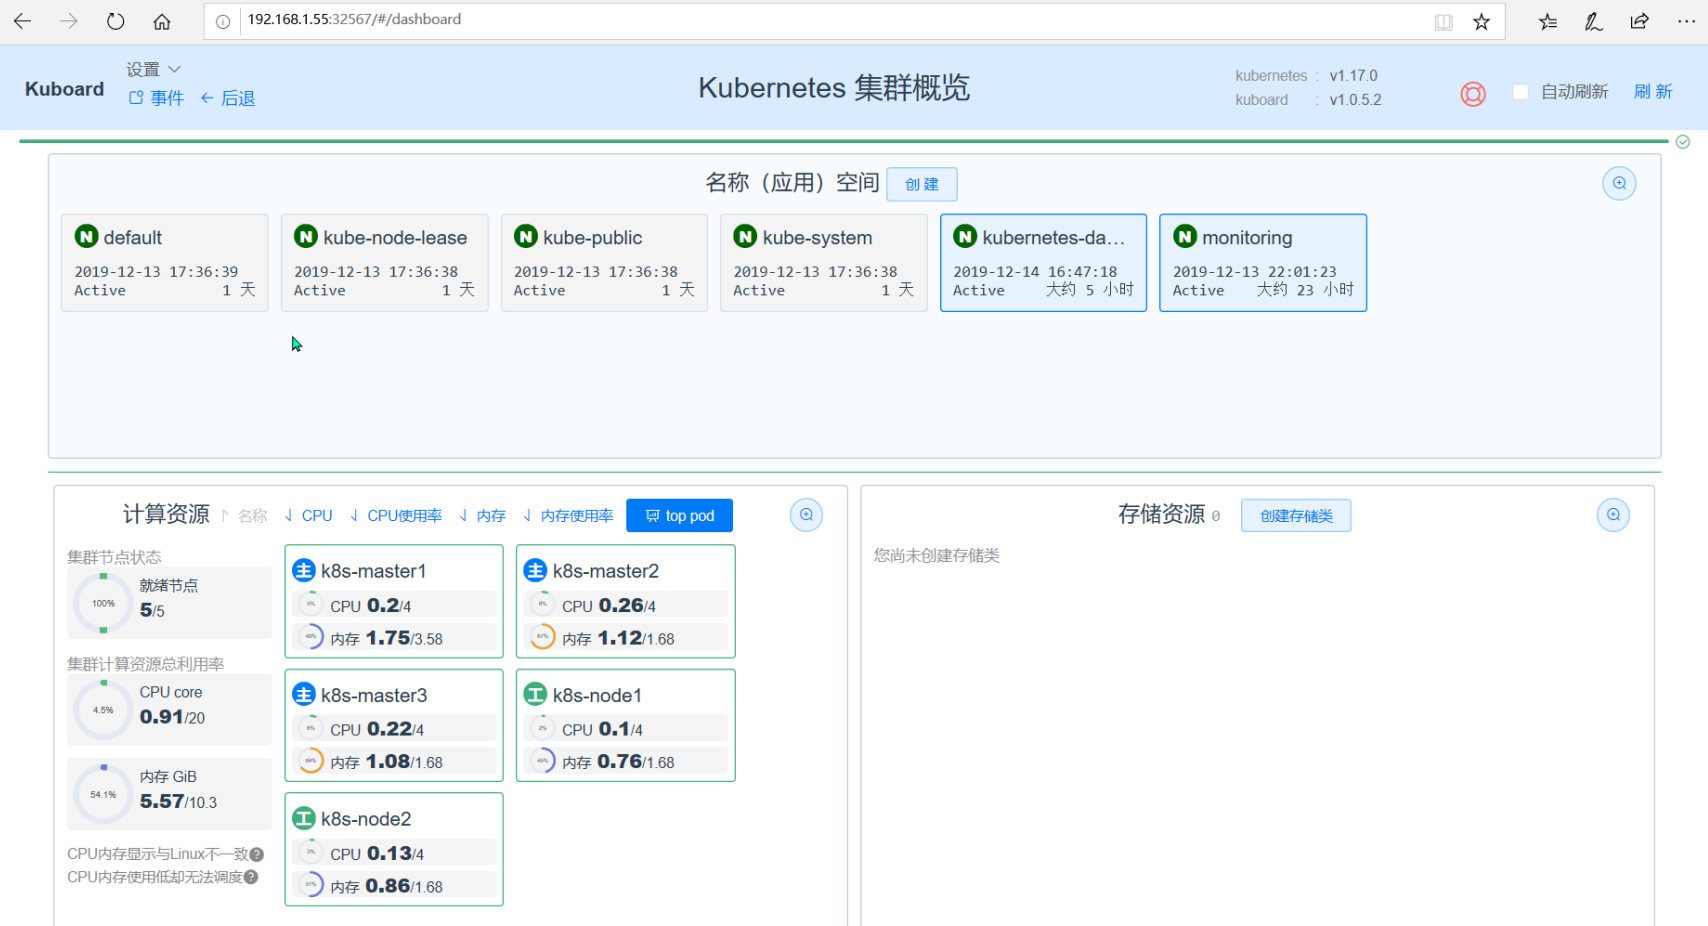
八、部署kuboard
参考:https://github.com/sealstore/dashboard/tree/kuboard
8.1 一键安装
[root@k8s-master2 ~]# sealos install --pkg-url https://github.com/sealstore/dashboard/releases/download/v1.0-1/kuboard.tar
[root@k8s-master1 1.8+]# kubectl get svc -n kube-system kuboard
NAME      TYPE       CLUSTER-IP     EXTERNAL-IP   PORT(S)        AGE
kuboard   NodePort   10.96.147.55   <none>        80:32567/TCP   7m34s
8.2 web访问
http+节点IP+32567
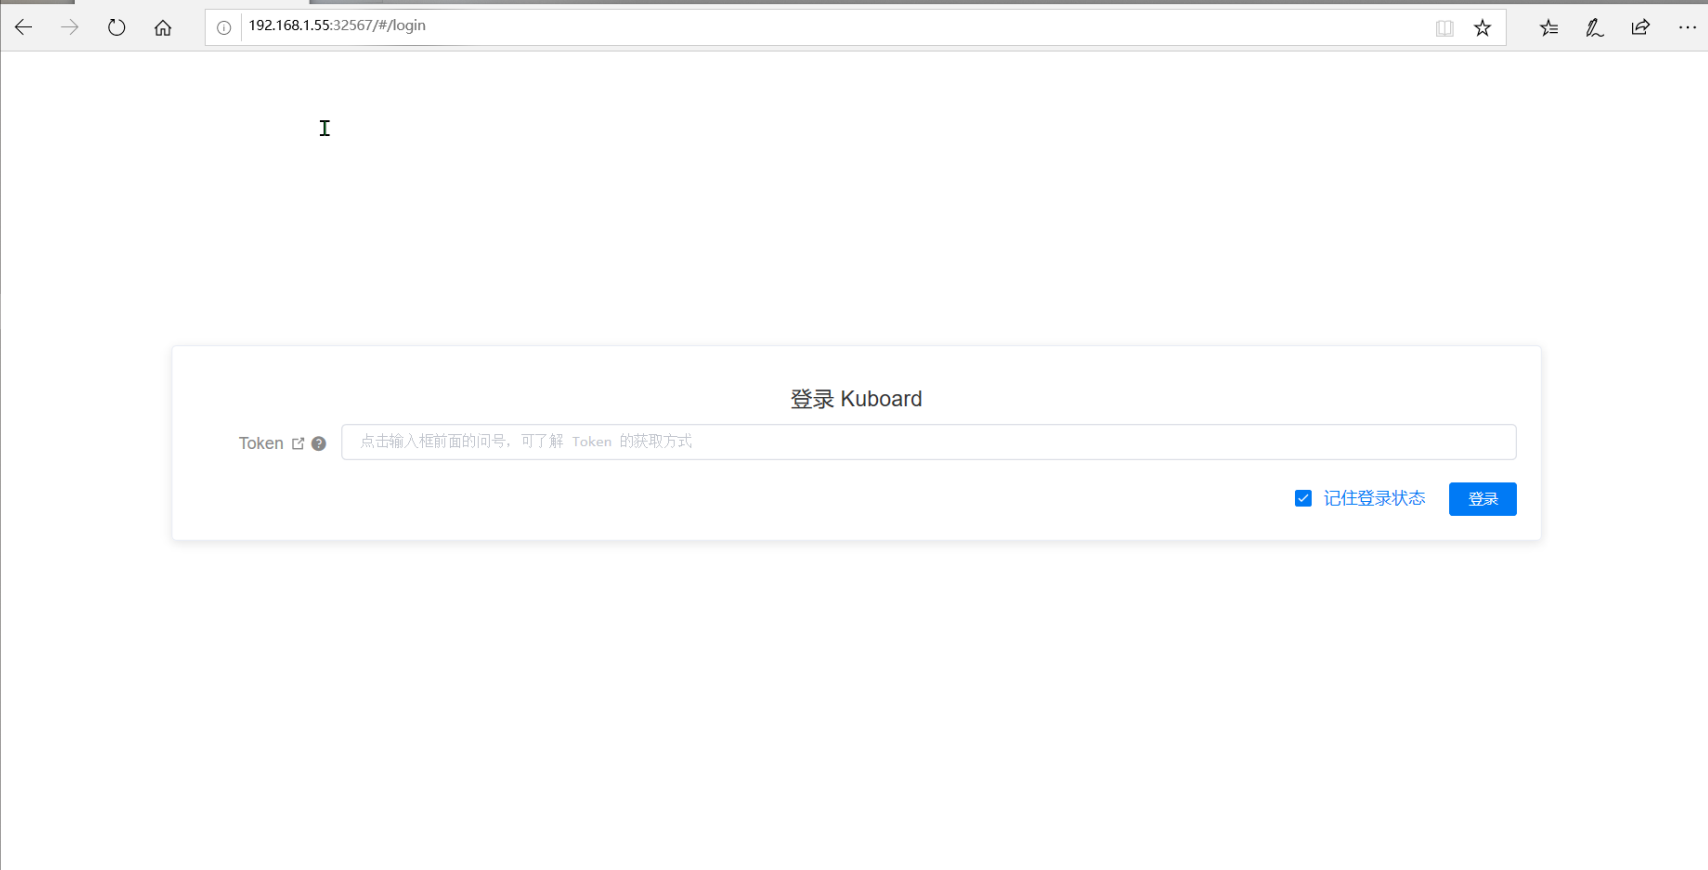
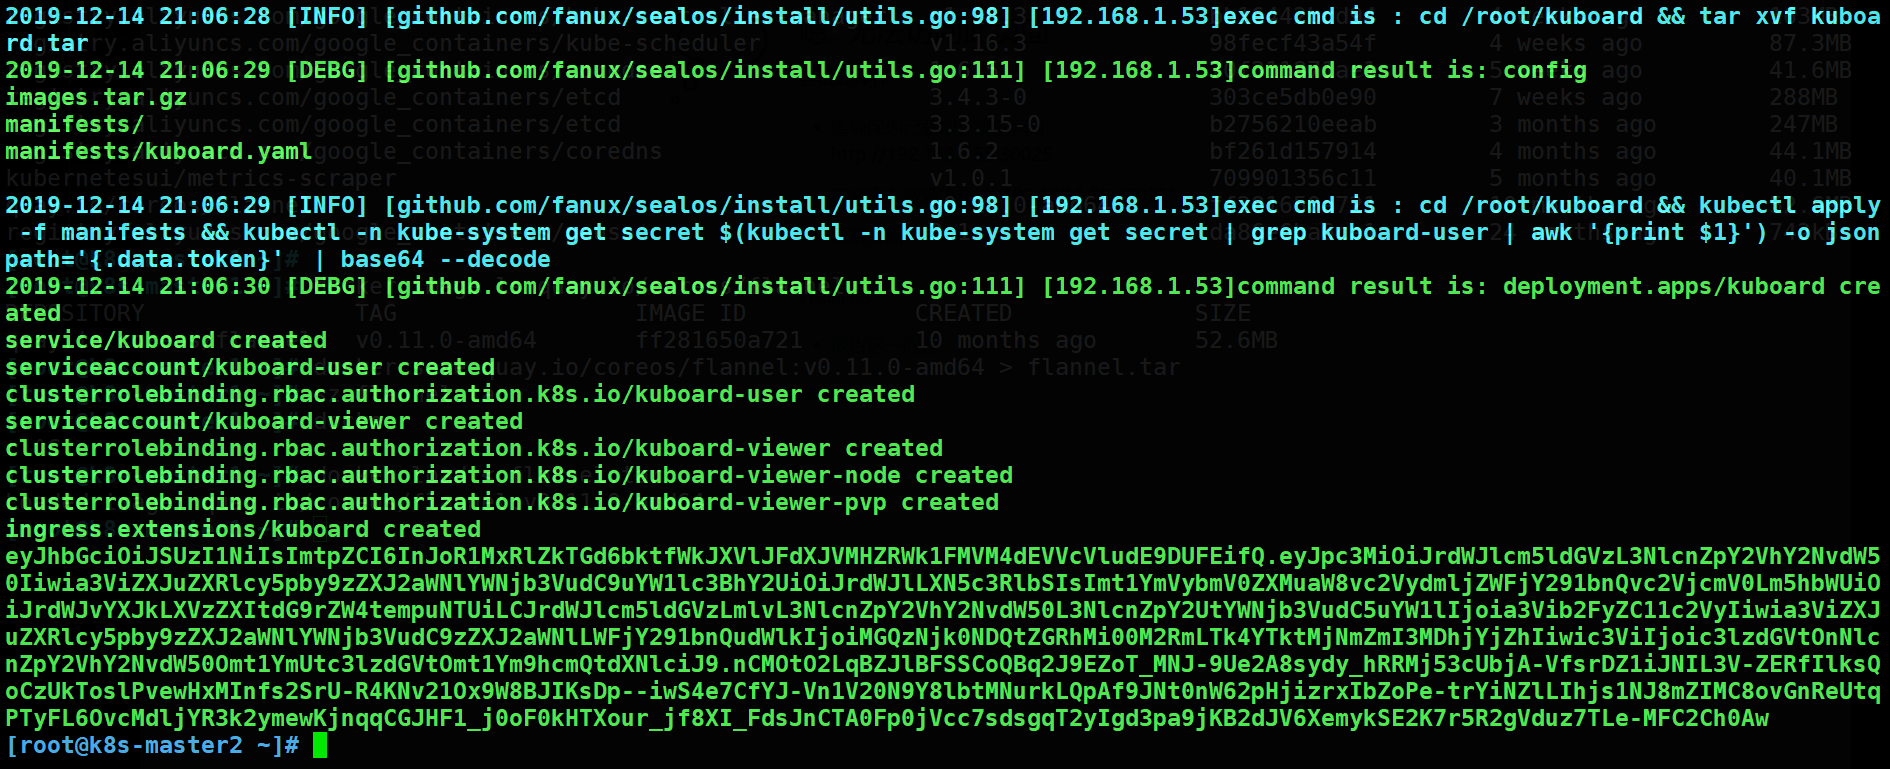
8.3 获取登陆token
管理员用户
[root@k8s-master1 1.8+]# kubectl -n kube-system get secret $(kubectl -n kube-system get secret | grep kuboard-user | awk '{print $1}')  -o jsonpath='{.data.token}'  | base64 --decode
eyJhbGciOiJSUzI1NiIsImtpZCI6InJoR1MxRlZkTGd6bktfWkJXVlJFdXJVMHZRWk1FMVM4dEVVcVludE9DUFEifQ.eyJpc3MiOiJrdWJlcm5ldGVzL3NlcnZpY2VhY2NvdW50Iiwia3ViZXJuZXRlcy5pby9zZXJ2aWNlYWNjb3VudC9uYW1lc3BhY2UiOiJrdWJlLXN5c3RlbSIsImt1YmVybmV0ZXMuaW8vc2VydmljZWFjY291bnQvc2VjcmV0Lm5hbWUiOiJrdWJvYXJkLXVzZXItdG9rZW4tempuNTUiLCJrdWJlcm5ldGVzLmlvL3NlcnZpY2VhY2NvdW50L3NlcnZpY2UtYWNjb3VudC5uYW1lIjoia3Vib2FyZC11c2VyIiwia3ViZXJuZXRlcy5pby9zZXJ2aWNlYWNjb3VudC9zZXJ2aWNlLWFjY291bnQudWlkIjoiMGQzNjk0NDQtZGRhMi00M2RmLTk4YTktMjNmZmI3MDhjYjZhIiwic3ViIjoic3lzdGVtOnNlcnZpY2VhY2NvdW50Omt1YmUtc3lzdGVtOmt1Ym9hcmQtdXNlciJ9.nCMOtO2LqBZJlBFSSCoQBq2J9EZoT_MNJ-9Ue2A8sydy_hRRMj53cUbjA-VfsrDZ1iJNIL3V-ZERfIlksQoCzUkToslPvewHxMInfs2SrU-R4KNv21Ox9W8BJIKsDp--iwS4e7CfYJ-Vn1V20N9Y8lbtMNurkLQpAf9JNt0nW62pHjizrxIbZoPe-trYiNZlLIhjs1NJ8mZIMC8ovGnReUtqPTyFL6OvcMdljYR3k2ymewKjnqqCGJHF1_j0oF0kHTXour_jf8XI_FdsJnCTA0Fp0jVcc7sdsgqT2yIgd3pa9jKB2dJV6XemykSE2K7r5R2gVduz7TLe-MFC2Ch0Aw
只读用户
[root@k8s-master1 1.8+]# kubectl -n kube-system get secret $(kubectl -n kube-system get secret | grep kuboard-viewer | awk '{print $1}') -o jsonpath='{.data.token}'  | base64 --decode
eyJhbGciOiJSUzI1NiIsImtpZCI6InJoR1MxRlZkTGd6bktfWkJXVlJFdXJVMHZRWk1FMVM4dEVVcVludE9DUFEifQ.eyJpc3MiOiJrdWJlcm5ldGVzL3NlcnZpY2VhY2NvdW50Iiwia3ViZXJuZXRlcy5pby9zZXJ2aWNlYWNjb3VudC9uYW1lc3BhY2UiOiJrdWJlLXN5c3RlbSIsImt1YmVybmV0ZXMuaW8vc2VydmljZWFjY291bnQvc2VjcmV0Lm5hbWUiOiJrdWJvYXJkLXZpZXdlci10b2tlbi1rYzltZyIsImt1YmVybmV0ZXMuaW8vc2VydmljZWFjY291bnQvc2VydmljZS1hY2NvdW50Lm5hbWUiOiJrdWJvYXJkLXZpZXdlciIsImt1YmVybmV0ZXMuaW8vc2VydmljZWFjY291bnQvc2VydmljZS1hY2NvdW50LnVpZCI6ImExYmI4ZDFlLWIzYjktNGM1Yi1iYjMyLTg2YWVmNTVlNzJlYyIsInN1YiI6InN5c3RlbTpzZXJ2aWNlYWNjb3VudDprdWJlLXN5c3RlbTprdWJvYXJkLXZpZXdlciJ9.dkBICHsBcVGGpCTuB7pwpUdqXbamHx4pAU0dFOQj_-w2DJtqxjCqAA-0hNxS_nk7k4fmgGZ7IXjrNKhqP1sBZBPOb9OdLDOPZgS6Juo-Rzwzu_Xh4CmPc_Mon00Kg-G80wwIk9-CgykYXMWOjIO_3fwuLvDMwhct6S50xrgWAymRd63LAFW4aAO9Uf_K3iP30MYKY-2IG8zkHBRtB0IEhNwRsMbZCLSgDw1QiLEMWNofWy-fFdg_STGaccKPgPl-2nTu5LdTdeaGYX-2UiYzVA28nso0rJ-3KOcF4hYytGv9ITj6UIeHpNYALB08G7BCshGePvKzugFajmT4BrMNDA
8.4 登录成功